Profitability Ratios – Definitions, Types, Formulas
Join over 2 million professionals who advanced their finance careers with 365. Learn from instructors who have worked at Morgan Stanley, HSBC, PwC, and Coca-Cola and master accounting, financial analysis, investment banking, financial modeling, and more.
Start for Free

Profitability ratios gauge how profitable a company is—i.e., how much its revenue exceeds its expenses.
Different types of profitability metrics measure different profit levels. Together, they are a powerful tool for analyzing a company’s profitability but provide little value when examined in isolation.
So, what do profitability ratios measure, and how do we calculate them?
What Is a Profitability Ratio?
Profitability ratios measure a company’s ability to generate profit relative to its sales, assets, and equity.
Typically, a higher value indicates better financial health. But these ratios are just numbers when seen in isolation. They provide meaningful information when analyzed compared to an industry benchmark, the firm’s competitors, or its past performance.
Profitability ratio analysis helps answer essential questions, including:
- Does a company produce value for shareholders?
- How well does it utilize its assets to generate profit?
- Does its financial performance improve or worsen over time?
- How does it compare to its peers and industry benchmarks?
There’s no uniform formula for profitability ratios; it varies depending on the type of ratio we calculate. But for all types, we use information from the company’s Income Statement. So, before we move on to the definition, formulas, and types of probability ratios, let’s go over the Income Statement’s structure.
Income Statement Structure
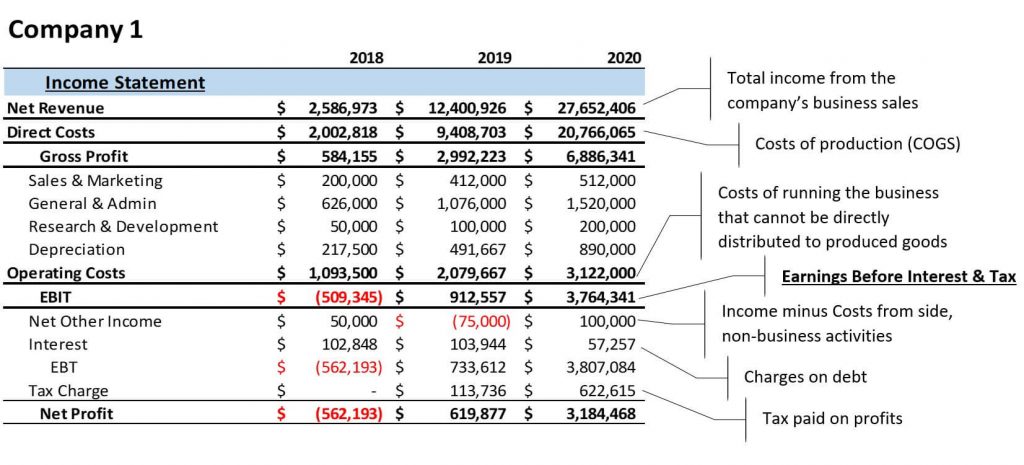
An Income Statement is a core financial statement that shows a firm’s financial performance over a given accounting period. It includes the following information:
- Top-line income (often from various revenue streams)
- Non-operating income (not business-related)
- Various groups of costs
The following table presents a breakdown of the components of a typical Income Statement.
Now that we know what a profitability ratio is and where to find the necessary information to calculate it, let’s examine the types of ratios.
Types of Profitability Ratios
The two primary groups of profitability ratios are margin and return multiples. They comprise several measures, each evaluating a company’s profitability differently. Let’s review the most common ones in financial analysis.
Margin Ratios
Margin ratios provide insights into a firm’s ability to generate profit from sales and the efficiency of its sales process. We obtain them by dividing profit by revenue. The three most important ratios from this category include gross profit margin, EBIT margin, and net profit margin.
The Income Statement above illustrates calculating gross profit, EBIT, and net profit. More detailed income statements may also show other profitability metrics, such as EBT, EBITA, or EBITDA. But for the current profitability analysis, we focus on these three profit levels.
Gross Profit Margin
The gross profit margin looks at the company’s profitability of production. It reveals whether a business sells its products at higher prices than their actual cost. The higher the gross margin, the more money there is to cover other expenses.
We obtain this profitability ratio with the following formula:
Gross~profit~margin=\frac {Revenue-Cost~of~Goods~Sold~(COGS)}{Revenue}=\frac {Gross~profit}{Revenue}Note that direct costs (see the Income Statement) comprise the costs of the goods sold (COGS) and not the ones that have been produced and warehoused (the inventory).
It’s rare to see negative margins at this level―if the produced items cost more than people are willing to pay, then the business is a non-starter.
Operating Profit Margin
The operating profit margin—earnings before interest and taxes (EBIT)—examines the business model’s profitability after accounting for production costs and running the business. We calculate this profitability ratio using the following formula:
EBIT~margin=\frac {Revenue-Direct~costs-Operating~costs}{Revenue}=\frac {EBIT}{Revenue}The higher the operating margin, the more profit there is—after taxes—to cover financial obligations, reinvest in the business, and distribute dividends to owners.
Note that the ‘other net income’ item in the Income Statement is below the EBIT line. This means the related costs are not part of the business model and should not influence operating profit.
Net Profit Margin
Is the business profitable after considering all costs? The net profit margin ratio answers this question by assessing the company’s overall profitability. Net income is what shareholders acknowledge being their return:
Net~profit~margin=\frac {Revenue-Expenses}{Revenue}=\frac {Net~profit}{Revenue}The higher the net margin, the more there is to reinvest and return to shareholders.
Other Profit Margins
The profitability ratios above do not exhaust the list of profit margins. One can use any combination of revenue minus costs metrics to obtain a profit margin, depending on the industry and purpose of the analysis, such as:
- EBITDA/Revenue looks at Earnings before interest, tax depreciation, and amortization and is used as a proxy for net cash flow from operations.
- EBT/EBIT considers the company’s tax burden and is a prominent part of the DuPont analysis.
Return Ratios
The other category of profitability ratios is return ratios, which measure the amount of generated profit relative to the funds invested in the business. We compute these by dividing a given profitability indicator by the amount of invested funds—typically, the total assets of a company. The profitability metrics are available in the Income Statement, and the invested funds are in the Balance Sheet.
Note that the Income Statement encompasses activities within a period. At the same time, the Balance Sheet provides a snapshot of a company’s assets, liabilities, and equity on a single day of the year. So, the right way to calculate ratios that mix values from the two financial statements is to use balance sheet averages. We typically do that by taking the sum of assets in two consecutive years and dividing it by two:
Average~total~assets_{2020}=\frac {Average~total~assets_{Y1}+Average~total~assets_{Y2}}{2} Let’s examine the two return ratios most commonly used by financial analysts.
Return on Assets
Return on assets (ROA) considers a company’s net profit (return) in relation to its capital. In other words, it evaluates whether the business makes enough profit given its size and the capital it employs. The higher the ROA, the better the company deploys its capital.
We use the following formula to calculate this measure of profitability:
ROA=\frac {Net~income}{Average~total~assets}We can also compute ROA with EBIT instead of net profit to obtain the operating ROA. Return on total assets disregards the company’s financing structure and expenses. Unlike net profit, EBIT includes interest expenses, which are part of the financing structure. So, operating ROA gives us a different perspective, indicating how profitable a company is in relation to its total assets.
Operating~ROA=\frac {EBIT}{Average~total~assets}Return on Equity
Return on equity (ROE) reveals the return a company generates for owners or how much profit it makes relative to shareholders’ invested capital. The higher the ROE, the more profit there is to reinvest in the business or pay dividends. From an investor’s perspective, this is one of the most important and tracked profitability ratios.
ROE=\frac {Net~income}{Average~total~equity}Return on equity is a critical assessment tool, frequently used as a starting point in financial analysis. It’s indicative of the firm’s overall performance. Below-average ratios suggest that the equity capital invested generates insufficient or lower profits than peer companies. We can decompose return on equity using the DuPont framework to identify the causes.
Beyond Profitability Ratios
Profitability ratios measure an organization’s ability to generate profit. But evaluating a firm’s financial health requires more than just a few margins. So, stakeholders use different types of ratios in conjunction.
Learn how to measure profitability, efficiency, solvency, liquidity, market prospects, and more in our comprehensive Financial Ratio Analysis course. Subscribe to our learning platform and take your financial analysis skills to the next level.
And if you wish to find out how to calculate these ratios in Excel, consider our profitability ratios model.