Activity Ratios – Definitions, Types, Formulas
Join over 2 million professionals who advanced their finance careers with 365. Learn from instructors who have worked at Morgan Stanley, HSBC, PwC, and Coca-Cola and master accounting, financial analysis, investment banking, financial modeling, and more.
Start for Free
Activity ratios (efficiency multiples) measure how well a firm manages its resources to generate revenue. They show how effectively a company converts net assets into profits.
What Are Activity Ratios?
Activity ratios measure a firm’s ability to leverage its assets to generate revenue. As a valuable tool for measuring how efficiently a company manages various balance sheet items, these multiples indicate how quickly capital and assets are converted into cash or sales.
Like other financial ratios, activity ratios provide meaningful insights compared to industry averages or the firm’s historical data. They bring little value when examined individually but, combined, offer a comprehensive insight into operating efficiency.
How Do We Calculate Activity Ratios?
Each activity ratio formula contains a Balance Sheet item in its denominator, and most activity ratios include an item from the Income Statement in their numerator.
Before we dive into the types of financial efficiency ratios, let’s examine the Balance Sheet and Income Statement components.
The Balance Sheet
You need to know the following about Balance Sheet items to calculate turnover multiples:
- Total assets provide a rough estimate of a company’s possessions, liquidation value, and size.
- Total liabilities show what the company owes to suppliers, partners, banks, and authorities.
- Equity consists of investments by owners and accumulated business profits.
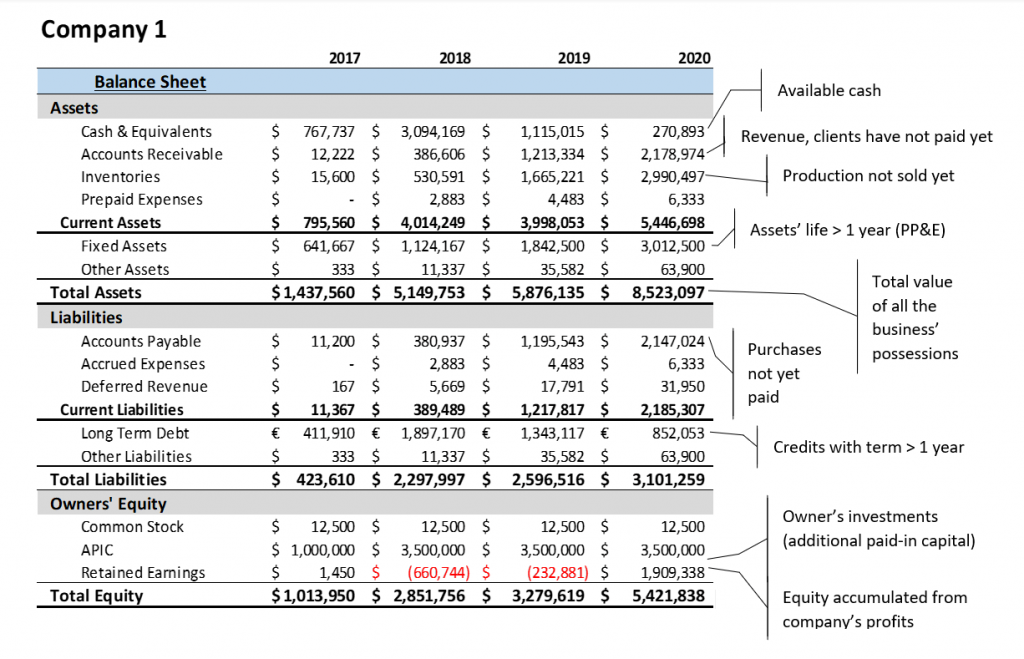
A company with many assets would be expected to generate high revenue to justify the invested capital. Check Box 1 for an analysis of Company 1’s performance based on the information in the Balance Sheet.
Key Insights from Company 1’s Balance Sheet:
1. In 2018, Company 1 increased its long-term debt nearly five-fold and had a sizeable external investment (Additional paid-in capital, APIC).
2. In the same year, its fixed assets doubled and its cash account nearly quadrupled the time progression within the year is unknown; we only see the beginning and ending amounts).
3. We don’t see what revenue it attracted, but the company generated significant losses, which greatly reduced its retained earnings account in 2018.
4. Still, over the next two years, the company kept investing its cash, increasing its fixed assets base, and paying back its debt, and it turned very profitable (see 2020’s retained earnings).
Income Statement
The Income Statement encompasses an entire period, while the Balance Sheet is a snapshot at the period’s end. So, when calculating activity ratios, we obtain the average of the start- and end-of-year values of the Balance Sheet items.
Average~total~assets{_{2020}}=\frac {Total~assets{_{2019}}+Total~assets{_{2020}}}{2}Start~of~year~assets{_{2020}}= End~of~year~assets{_{2019}}Alternatively, use the average calculator to find the average of the start- and end-of-year values of the balance sheet data without using any formula.
This approach smooths out the outstanding amounts and limits distortions in case of significant fluctuations.
Types of Activity Ratios
Activity ratios assess an organization’s ability to manage its assets efficiently, which helps identify potential areas of improvement. The most commonly used turnover multiples include:
- Asset
- Equity
- Receivables
- Inventory
- Payables
Asset Turnover
Asset turnover reflects a company’s overall efficiency by comparing revenue with average total assets. It reveals whether the firm can attract enough customers (generating revenue) for the amount of capital it employs.
Total~assets~turnover= \frac {Revenue}{Average~total~assets}The higher the asset turnover, the more efficiently the company utilizes its asset base. Asset utilization ratios below 1 indicate an overstretched asset base. A popular iteration of the ratio is substituting total assets with fixed assets to assess the capital investments’ efficiency.
Fixed~assets~turnover= \frac {Revenue}{Average~fixed~assets}Equity Turnover
Equity turnover reveals whether a firm generates sufficient revenue from its shareholders’ equity.
The equity turnover ratio formula includes the following:
Equity~turnover= \frac {Revenue}{Average~total~equity}And while it’s a helpful indicator of management’s efficiency, it may be skewed by a large proportion of debt in a firm’s capital structure. In other words, a high equity turnover ratio may conceal management’s inefficiency if a company has too many assets and too much debt. So, we must interpret this metric cautiously.
Receivables Turnover
Receivables turnover reflects a company’s credit policies in collecting its clients’ dues (revenue). The higher the receivables turnover, the more quickly the company turns sales into cash.
Receivables~turnover= \frac {Revenue}{Average~receivables}This activity ratio is rarely used as a standalone measure; it’s one of the three pillars that form a firm’s net trading (or cash conversion) cycle. (We discuss it in more detail below.)
Inventory Turnover
Inventory turnover measures a firm’s inventory management efficiency—i.e., how quickly it sells its production (inventory). The higher the inventory turnover, the less value the company locks in its warehouses.
Inventory~turnover= \frac {Cost~of~goods~solved (COGS)}{Average~inventory}This activity ratio is also seldom used as a standalone measure. Combined with receivables, it forms the basis of a company’s operating cycle. In addition, it is the second pillar of the cash conversion cycle.
Payables Turnover
The last pillar of the cash conversion cycle (payables turnover) considers the company’s payment policies to its suppliers. The higher the payables turnover, the more quickly the company pays its suppliers and creditors.
Payables~turnover= \frac {Total~purchases}{Average~payables}Unlike the activity ratios discussed above, the payables turnover’s calculation features an item that cannot be readily found on the firm’s Income Statement: total purchases.
Direct costs include purchases, salaries, and other costs directly related to the production process. As external analysts may lack the information to estimate total purchases, they often substitute it with Cost of goods sold (COGS) plus ending inventory minus beginning inventory.
Total~purchases= COGS+Ending~inventory-Beginning~inventory
And some practitioners use just COGS as a proxy for purchases instead of adding and subtracting inventory accounts.
Payables~turnover= \frac {COGS}{Average~payables}While these current assets and liabilities ratios provide insight into management’s efficiency, they are more commonly used as a basis for the calculation of the cash conversion cycle (CCC) metric.
Cash Conversion Cycle
The net trading (or cash conversion) cycle reveals how long it takes on average for a company to sell its inventory, receive money from customers, and pay suppliers. We use three turnover ratios to calculate this:
- Days Sales Outstanding (DSO)
- Days Inventory Outstanding (DIO)
- Days Payable Outstanding (DPO)
Then, we apply the following formula to obtain the cash conversion cycle (CCC):
Cash~Conversion~Cycle=DSO+DIO-DPO
Days Sales Outstanding (DSO)
The DSO measure looks at the average time to receive cash from clients. In other words, it estimates the time a firm needs to turn sales into cash.
We calculate the DSO by reversing one of the activity ratios (receivables turnover) and multiplying it by the number of days in the period under review. To avoid the peculiarities of the modern calendar, analysts usually standardize it to 30 days a month, 90 days a quarter, and 360 days a year:
DSO{_{Yr}}=\frac {Average~receivables}{Revenue} \times 360 \qquad or \qquad Receivables~turnover \times \frac {1}{360}The higher the DSO, the more significant the delay in the cash receipts and the risk from a liquidity standpoint. This also means that a company will need more funds to grow its sales because it must pay bills and salaries before it has received its clients’ payments. In other words, growing will require more extensive investment in working capital.
Days Inventory Outstanding (DIO)
Days inventory outstanding considers the average time a company takes to sell its products. In other words, it measures the time a firm needs to turn production into sales. To calculate it, we reverse another activity ratio (inventory turnover) and multiply it by the number of days within the period under review:
DIO{_{Yr}}=\frac {Average~inventory}{COGS} \times 360 \qquad or \qquad Inventory~turnover \times \frac {1}{360}The higher the DIO, the longer a company takes to sell its products and the more liquidity and working capital constraints it will face to grow.
The sum of DSO and DIO gives us the company’s operating cycle.
Days Payables Outstanding (DPO)
The DPO measure considers the average time a company takes to pay its suppliers. We calculate it by reversing the payables turnover activity ratio and multiplying it by the number of days within the period under review:
DPO{_{Yr}}=\frac {Average~payables}{COGS} \times 360 \qquad or \qquad Payables~turnover \times \frac {1}{360}The higher the DPO, the longer it takes the company to pay its suppliers. Unlike the other two ratios, this works to the firm’s advantage because it makes it easier to maintain liquidity and allows more funds to be used in production.
DPO is a serious (and free-of-charge) source of working capital, especially for companies that do not depend on their suppliers, which gives them more negotiating power.
Beyond Activity Ratios
We examined common types of efficiency ratios and several ways to combine them to measure a firm’s operating efficiency. If you wish to calculate these ratios in Excel, download our activity ratios template. You can also learn about other crucial financial ratios in our dedicated valuation, profitability, solvency, and liquidity articles. But the power of financial analysis lies in the ability to combine and interpret these financial health indicators. So, take your skills to the next level with our Financial Ratio Analysis course.
FAQs
Financial ratios allow us to examine the relationship between various components of a firm’s financial statements. They are crucial to financial ratio analysis, providing insights into companies’ financial health. Financial ratios allow investors, analysts, and internal financial experts to evaluate a firm’s performance over time and compare it to other companies and industry benchmarks.
Efficiency ratios, activity ratios, and turnover multiples refer to the same concept—a group of metrics measuring a firm’s operating efficiency or ability to utilize assets to generate revenue. Each activity ratio provides insight into a different aspect of a firm’s management capabilities. This article examines the most commonly used turnover multiples and their calculations and interpretations.