What Is Ratio Analysis?
Join over 2 million professionals who advanced their finance careers with 365. Learn from instructors who have worked at Morgan Stanley, HSBC, PwC, and Coca-Cola and master accounting, financial analysis, investment banking, financial modeling, and more.
Start for Free

Ratios are simple but powerful tools in the financial analyst’s toolbox. Internal and external stakeholders, such as investors, analysts, a firm’s management, and creditors, use them to evaluate various aspects of a company’s financial health.
Mathematically, a ratio (or multiple) indicates how many times one number (X) contains another number (Y). We calculate it by dividing X by Y. We obtain financial ratios by dividing two line items from a firm’s financial statements.
This article addresses five main types of ratios, widely used in financial analysis and modeling. We explain what ratio analysis is, its importance, and when and how to use it.
What Is Ratio Analysis?
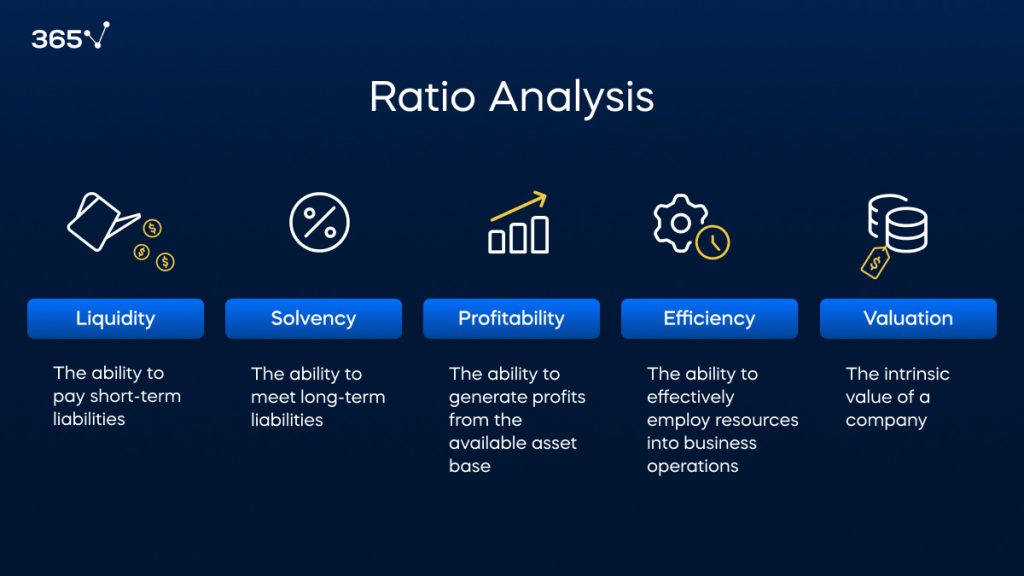
Ratio analysis evaluates a company’s profitability, liquidity, solvency, and operational efficiency using information from its financial statements. It gives insights into a company’s financial performance over time, against an industry benchmark, or compared to another business.
Each ratio provides information about a different aspect of a company’s financial health. Used in isolation, they can be misleading. But together, they are a powerful tool for identifying strengths and pitfalls.
Major Categories of Financial Ratios
There are five major types of financial ratios, each examining a different aspect of a company.
1. Profitability Ratios
Profitability ratios reflect an entity’s profit compared to other businesses in the industry or over time. They reveal whether a firm’s ability to generate profits increases compared to previous periods. There are several types of profitability ratios, including:
- Gross profit margin
- Operating profit margin
- Pre-tax margin
- Net profit margin
These multiples can provide information on the company’s cost structure when viewed as a group.
2. Activity Ratios
Activity (efficiency) ratios evaluate how efficiently a company manages its normal business operations. This indicates the firm’s ability to leverage its resources to maximize earnings.
Important efficiency ratios include:
- Receivables turnover
- Payables turnover
- Working capital turnover
- Inventory turnover
- Days of sales outstanding
- Days of payables
- Days of inventory on hand
- Cash conversion cycle
3. Liquidity Ratios
Liquidity ratios gauge a firm’s ability to meet its short-term obligations and repay its debts using its assets. They show how exposed the company is to liquidity shortages. The key liquidity financial ratios include the following:
- Current ratio
- Quick ratio
- Cash ratio
- Defensive interval
4. Solvency Ratios
Solvency (financial leverage) ratios reveal a company’s ability to meet its long-term obligations. They compare a firm’s debts to its assets, equity, and earnings.
The most important solvency financial ratios include the following:
- Debt-to-equity
- Debt-to-assets
- Debt-to-capital
- Interest coverage
- Fixed-charge coverage
- Financial leverage
5. Valuation Ratios
Valuation (market prospect) ratios measure the relationship between a company’s intrinsic value or owners’ equity and some fundamental financial metric. Investors use this financial ratio analysis to predict earnings and future performance.
The most important valuation ratios include the following:
- Earnings per share (EPS)
- Price-earnings ratio (P/E)
- Dividend yield
- Retention rate
- Dividend payout ratio
Find the most common financial ratios’ formulas and interpretations in our free Financial Ratios at a Glance cheat sheet.
Applications of Ratio Analysis
We can calculate all financial ratios using a firm’s financial statement information, which is publicly available. This allows us to obtain insights about any company.
But what can we learn? What are financial ratios used for?
Ratio Analysis Over Time
A single ratio shows us where a company stands today, which is a meaningless piece of information on its own. That’s why investors typically use historical data to perform ratio analysis. Comparing financial ratios from several reporting periods reveals performance trends.
This allows us to detect the rate at which a given aspect of performance changes, whether it improves over time, and the impact of seasonality and temporary fluctuations.
Ratio Analysis Across Companies
Industries have different ratio expectations, and a competitor’s performance determines a business’s success to a great extent. A good P/E ratio in one industry may be considered low in another.
So, comparing key financial ratios of similar companies allows us to better understand their standing. Of course, factors like size, structure, products and services sold, etc. also influence financial outcomes and should be considered when comparing financial ratios.
Ratio Analysis Against Benchmarks
Financial ratio analysis is also a valuable tool to measure performance against benchmarks. These can be industry averages or internal targets. Such comparisons can help a company adjust its strategy depending on industry trends and its changing needs.
Lenders can also set benchmarks as a requirement for the firm’s financial health. If a given ratio falls before a predetermined value, the loan can be callable, or the interest rate may increase.
What Is Ratio Analysis? Next Steps
Barring a few exceptions, most ratios are not very useful as standalone measures. The real value of ratio analysis lies in comparing various multiples across companies, with industry averages, and over time.
We teach all this and more in our dedicated Financial Ratio Analysis course. Sign up for our learning platform and start learning for free.