DuPont Analysis – A Pyramid of Ratios
Join over 2 million professionals who advanced their finance careers with 365. Learn from instructors who have worked at Morgan Stanley, HSBC, PwC, and Coca-Cola and master accounting, financial analysis, investment banking, financial modeling, and more.
Start for Free

Ratio analysis is a powerful technique widely used by financial analysts across the globe. There is virtually no way to analyze a business without examining a set of ratios from its financial statements. As powerful as it may be, ratio analysis is rarely enough just on its own. A more comprehensive examination requires taking a step further for a more in-depth understanding of a company’s ratios. There is a well-known and widely used approach to such an analysis and it starts with one of the key profitability ratios.
Return on equity
Return on equity is amongst the most important ratios, especially from an investor’s standpoint, because:
- Unlike most other ratios, it takes numbers from both the income statement and the balance sheet – so it examines both the business’ operational performance and its financial position;
- Unlike most other cross-statement ratios, it takes bottom-line numbers or totals; in other words, it does not focus on some fraction (like DIO on inventory or DPO on payables), but looks at the big picture;
- And last but not least, it goes straight to the point most investors are interested in: what did we make on our investment?
Its importance and comprehensiveness make it the perfect target for a more thorough investigation. Digging a little deeper into ROE’s composition, its drivers and their influence on it, should help us understand the business we are analyzing in a better and more integrated way.
DuPont Analysis
About a hundred years ago, a man named Frank Donaldson Brown came up with a framework that nicely decomposes a company’s ROE into constituent parts that are informative in and of themselves. As Mr. Brown was the treasurer of DuPont at the time, his framework became known as DuPont Analysis (a.k.a. DuPont’s Model or DuPont’s Pyramid).
The framework is widely used to this day by financial analysts because, by decomposing one of the most important ratios of any business, it provides a clear and comprehensive view into its financials.
How does it work?
Step 1
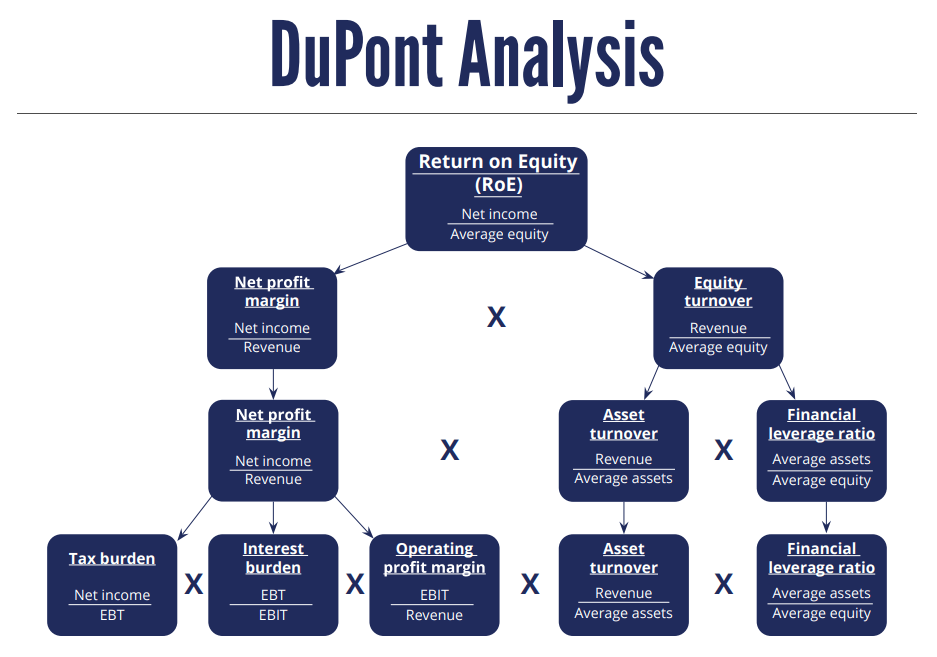
Start by decomposing Return on Equity into its key components. This is how it looks mathematically:
ROE = \frac{Net~Income}{Avge~Total~Equity} = \frac{Net~Income \times Avge~Total~Assets}{Avge~Total~Equity \times Avge~Total~Assets} = =\frac{Net~Income}{Avge~Total~Assets} \times \frac{Avge~Total~Assets}{Avge~Total~Equity}= ROA \times LeverageSo, return on equity depends on what the company returns on all its assets (ROA), and that gets multiplied by the company’s leverage (sometimes called equity multiplier). If the company is highly leveraged, then equity owners would be getting more return on their investment. That is demonstrated in our practical example but – long story short – if a company has no liabilities, equity equals assets, and then ROA is multiplied by 1/1 = 1; if a company has 50% equity and 50% liabilities, ROA is multiplied by 1/0.5 = 2.
Step 2
Return on Assets is decomposed into its key components so we can better understand wat drives it:
ROA = \frac{Net ~Income}{Avge~Total~Assets} = \frac{Revenue \times Net~Income}{Revenue \times Avge~Total~Assets} == \frac{Revenue}{Avge~Total~ Assets} \times \frac{Net~Income}{Revenue} = Asset~Turnover \times Net~Profit~MarginSo, the return on the company’s assets depends on the amount of revenue it could generate using these assets, and then on the overall profitability of that revenue (once all the costs have been removed).
We can now see that a company’s ROE can be decomposed to its net profit, asset turnover, and leverage. That is what the 3-way DuPont model looks like:
ROE = \frac{Net Profit}{Revenue} \times \frac{Revenue}{Avge~Total~Assets} \times \frac{Avge~Total~Assets}{Avge~Total~Equity}So, we have profitability, efficiency, and leverage. All three can greatly influence ROE:
- High profitability is an obvious driver of return on equity – a higher portion of clients’ money go into the firm;
- High efficiency (turnover) can drive ROE up through volume – more money comes in relative to the firm’s size;
- High leverage multiplies the first two – as ROA goes to a smaller portion on the right side of the balance sheet.
Step 3
Net profit margin can be decomposed further so that we can see the relationship between operating profit, interest burden, and tax burden.
Net~Profit~Margin = \frac{Net~Profit}{Revenue} = \frac{Net Profit}{EBT} \times \frac{EBT}{EBIT}\times \frac{EBIT}{Revenue}So, we can see that overall profitability depends on the profitability of the company’s operations but also on what has to go to its creditors and the tax authorities. The first two ratios’ maximum value can be 1. That is the best possible scenario as far as profit is concerned: in that case, Net Profit = EBIT and there is no taxation or interest payments. However, the former would mean there is no profit to speak of (otherwise there’d be taxes); and the latter suggests no long-term debt, which would in turn mean lower leverage, and so ROE would most likely suffer under such an arrangement.
This is the 5-way DuPont analysis, where we have this long chain of ratios:
ROE = \frac{Net~Profit}{EBT} \times \frac{EBT}{EBIT} \times \frac{EBIT}{Revenue} \times \frac{Revenue}{Avge~Total~Assets} \times \frac{Avge~Total~Assets}{Avge~Total~Equity}If we look at them over time and compare them to industry averages, we can identify areas of strengths and weaknesses or emerging trends.
The Pyramid of Ratios
There is a popular graphical representation of the DuPont framework, known as the pyramid of ratios. While it notes leverage, it is mostly focused on the return-on-assets part (a.k.a. return on capital) and the relationship between profitability and efficiency.
Unfortunately, this is hard to represent over time; yet, it can give a very clear picture of the situation at present and can be an invaluable tool for managers and investors.
Limitations of DuPont Analysis
Similar to other ratios, DuPont analysis is only as good as the data that go into it. Accounting treatment of certain expenses (e.g. capitalization of interest, different cost flow methods, etc.) can distort the numbers that form the ratios; therefore, analysts should be careful and make the necessary adjustments when comparing two companies. However, this is not unique to DuPont’s only: it can be stated for any other financial analysis method.
It also does not reveal why certain ratios are higher or lower or even if they should be considered high or low per se. Still, looking at the DuPont framework over time and in comparison to industry averages can quickly reveal:
- what drives a company’s ROE,
- what could be the long-term implications of this, and
- should its management focus its efforts on cost control, asset management or the debt burden.
For a fundamental understanding and practical applications of the model, go ahead and read the article “DuPont Analysis: A Practical Example”.
If you want an example of an DuPont Analysis in Excel, take a look at our DuPont Analysis Excel model.