Financial Analysis: Why do Companies Need it?
Join over 2 million professionals who advanced their finance careers with 365. Learn from instructors who have worked at Morgan Stanley, HSBC, PwC, and Coca-Cola and master accounting, financial analysis, investment banking, financial modeling, and more.
Start for Free

Any company, whether a startup or a long-respected staple in the community, is subject to the health of their finances. No marketing campaign or company reorganization can bandage an unhealthy financial position, and many business owners frequently lose sleep over their financial standing. How should they determine where their business stands financially and what direction they should pursue? Financial analysis is an objective, tried, and true method with many facets that helps analysts address these issues as they arise.
Financial Analysis Techniques
There are quite a few methods used to perform financial analysis. Each has a different way of bringing to light a specific aspect of a company’s standing in order to gauge its financial health. Here we will focus on the two most common ones: financial ratio analysis and common-size financial analysis
What is Financial Ratio Analysis?
Ratio Analysis is one of the most popular ways of interpreting financial results. Many internal and external stakeholders, such as investors, analysts, firms’ management, and creditors use it as a means of performance evaluation.
The analysis of ratios gives useful insights into a firm’s efficiency of operations, liquidity, solvency, and profitability, as well as its valuation metrics. It simplifies complex accounting and financial data into easy-to-understand “nuggets” of information.
Types of Financial Ratio Analysis
In general, we distinguish between two major sub-types of analysis.
Time series, also known as trend analysis, involves the examination of a company’s historical ratios.
In most cases, past performance is an indication of what might occur in the future, so it’s worth checking out how certain multiples evolved over time.
Cross-sectional analysis, on the other hand, allows us to compare the performance of different companies (regardless of their size and growth potential) to an industry average.
Financial Ratio Analysis: Pros and Cons
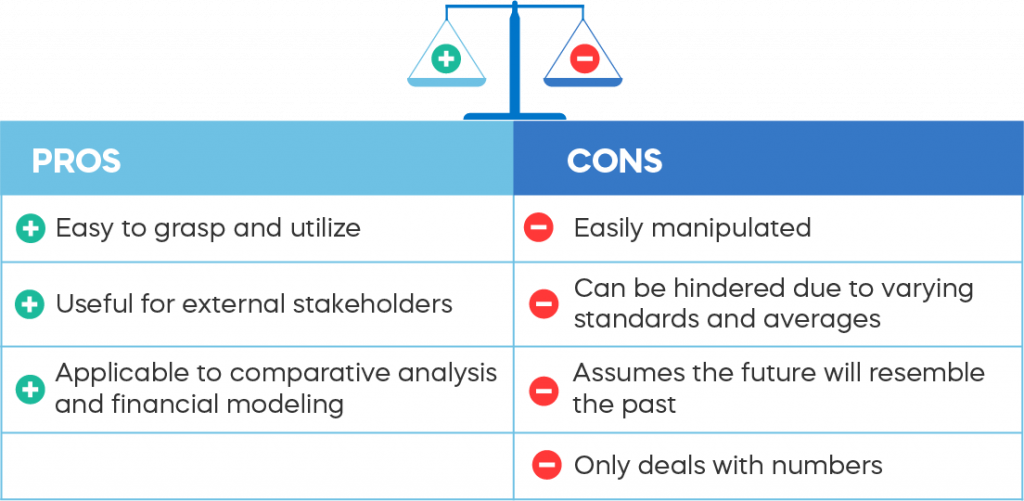
Pros
From a broader perspective, what makes ratio analysis so functional in the first place?
Firstly, it is very straight-forward. When a rough approximation is needed, you can quickly evaluate the multiples of a company, given that you have its financial statements in front of you.
Second, it’s useful to external parties who lack the details around a firm’s internal operations. Potential investors, for example, run through an enterprise’s published data, to get a grasp of its overall stability.
And finally, many ratios incorporate market sentiment. If markets are truly efficient, ratio analysis provides the means for better comparability of different organizations. Furthermore, ratios are integrated into various financial models used for forecasting future performance results.
Cons
First and foremost, the comparability of data between two or more companies is limited due to the alternative accounting standards they work with. Ratios are largely affected by the accounting policies, management judgment, and estimations and are, therefore, biased in that context. All too often financial information may be manipulated or “massaged” in a way to show better results. So, analysts should be mindful of the quality of published financial reports and apply ratio analysis with caution.
Moreover, cross-sectional analysis is not always meaningful, as comparable standards and industry averages may be unavailable. So, make sure you compare “apples to apples” before jumping into any conclusions. Ratios themselves are not useful in isolations, they need to be analyzed on a relative basis.
Another limitation of ratio analysis is the affinity to look mostly at historical performance and the assumption that past trends will continue in the future. Well, this may not always be the case. There are many dynamic factors, such as economic downturns or political decisions, that change over time, yet determine a company’s outlook.
On a separate note, ratio analysis deals with numbers and numbers only. So, you won’t find anything about a firm’s human capital, brand reputation, or the size of the order book there. Hence, it won’t paint the whole picture of an organization.
What is Common-Size Financial Analysis?
Besides ratios, some other tools and techniques may supplement financial analysis.
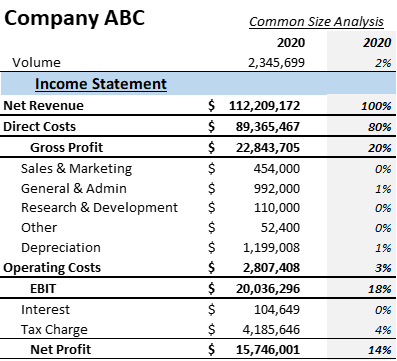
For instance, you can employ a common-size analysis. Common-size financial statements (be it Balance Sheet, P&L, or Cash Flow) express various line items as a percentage of either total assets or revenue.
Every Common-Size Income Statement will show you the gross profit, operating profit, and net profit margins of a company. Whereas the Common-Size Balance Sheet illustrates the solvency position of a company at a snapshot. Similarly, you can evaluate a firm’s cash-generating abilities by looking at its Common-Size Cash Flow Statement.
Since these reports represent a “one-page” summary of financial performance, you can quickly identify current trends or items that need to be closely investigated.
Vertical vs. Horizontal Analysis
There are two types of common-size analysis:
Vertical Common-Size Analysis
With this method, financial analysts present each line item in a particular financial report as a percentage of the whole. For example, if we’re looking at the income statement of company X, and they have Net Revenue amounting to $4 million, and Cost of Goods Sold (COGS) totaling $2 million, we would perform this formula to find the vertical analysis of COGS:
\frac { \$2,000,000} {\$4,000,000 } \times 100 = 50%We can gain some great insights from just this one calculation. Say, if the vertical analysis of COGS is increasing in percentage year to year with no increase in sales. This can be an indicator of a larger problem and a potentially unhealthy financial position for the organization in question.
This type of financial analysis is called “vertical” because, typically, the percentages will be included in a line item descending vertically on each financial statement, next to the specific item they are transforming into a percentage. This method makes it easy for analyzers to compare percentages across competitors as well as past company performance within the same business.
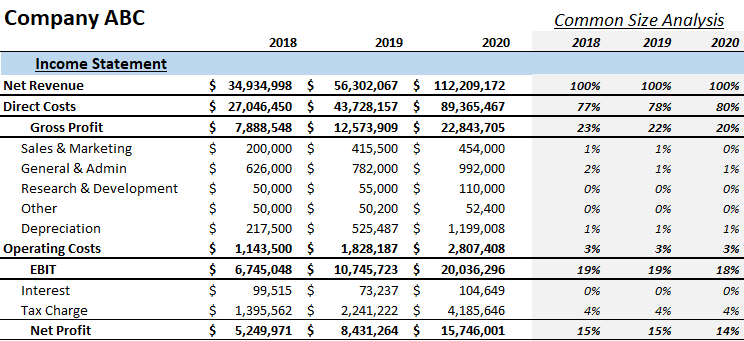
Horizontal Common-Size Analysis
Horizontal analysis can be considered the method of “historical” analysis, and it focuses on the comparison of different periods in a businesses’ history. When you think of horizontal analysis, think of a historical timeline, resulting in a horizontal orientation.
Instead of the vertical analysis’ comparison of line items within a certain financial statement, horizontal analysis compares current line items to past line items on several different financial statements within the same company.
For example, say company Y has Gross Profit amounting to $4 million in the current reporting year. When they look back to 3 years ago, they discover that their Gross Profit totaled $2 million back then. For comparison’s sake, the past Profit is represented as 100% to show growth or decline up until the present. To horizontally analyze the Gross Profit line item, the following formula can be applied:
\frac {\$4,000,000 - \$2,000,000} {\$2,000,000} * 100 = 100%This finding indicates that the company’s profit has increased by 100% in the past 3 years, and it can be a helpful indicator for internal analyzers and potential investors alike. Horizontal analysis as a whole can be great for setting internal company goals based on past trends to understand the feasibility of certain benchmarks.
What’s Next?
Analyzing a company’s finances with these techniques could result in a lucrative investment choice, a smart business move, or even avoiding an expensive mistake. These methods provide a helpful depiction of an organization’s financial health and understanding how to conduct and read a financial analysis can give professionals a leg up in the business world. This skill shouldn’t be overlooked. Looking for a great place to start in your journey to learn more about financial analysis? Check out our Financial Reporting & Analysis Course to get a good grasp of the process from start to finish.
Ready to take the next step towards a career in Finance?
From foundational topics in Accounting and Financial Analysis, through Corporate Finance and M&A, to specialized Fintech and Economics courses, the 365 Financial Analyst curriculum is designed to prepare you for the world of Finance as it is today. Whether you are a total beginner or a working professional, our expert-led courses offer the opportunity to upskill at your own pace. Find the right fit for you and start learning today!