What is a Common-Size Income Statement?
Join over 2 million professionals who advanced their finance careers with 365. Learn from instructors who have worked at Morgan Stanley, HSBC, PwC, and Coca-Cola and master accounting, financial analysis, investment banking, financial modeling, and more.
Start for Free

Common-size income statements are very useful when trying to understand a business’s performance, especially when compared to peers. While they don’t tell you the whole story at a glance, they do a very good job in identifying areas of potential interest for further investigation.
When it comes to financial statement analysis there are two broad approaches to number crunching – horizontal and vertical. As the names imply:
- Horizontal analysis looks at the rows on a statement: it takes a line item, such as revenue or EBIT, and compares it over time;
- Vertical analysis looks at the columns on a statement: it takes the different numbers in a single column and compares them to a specific item in the same column (usually the largest one). It is this comparison that converts a financial statement to a common size financial statement. It also forms the basis of ratio analysis.
Let’s get practical!
Below is a look into how a really quick horizontal analysis of an income statement would look like:
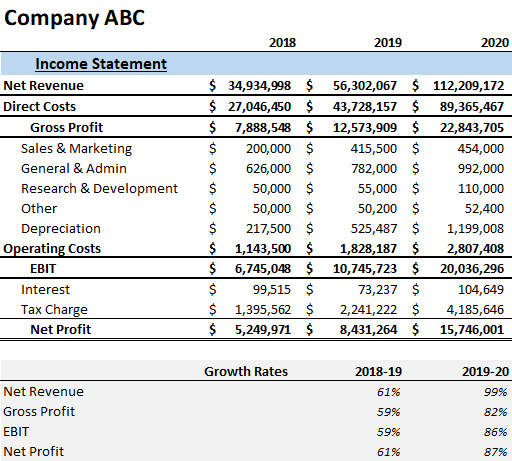
Company ABC is, of course, fictitious and those numbers are made up. The analysis looks at the horizontal lines of revenue, gross, operating, and net profits and compares them over the last two years (usually, the same analysis will be done for ABC’s costs).
In our case, there is what appears to be robust growth that has accelerated strongly in the last year. And it is worth noting that profits rise in conjunction, though not as fast as revenue. This is not uncommon as businesses often tend to sacrifice profit for the sake of growth.
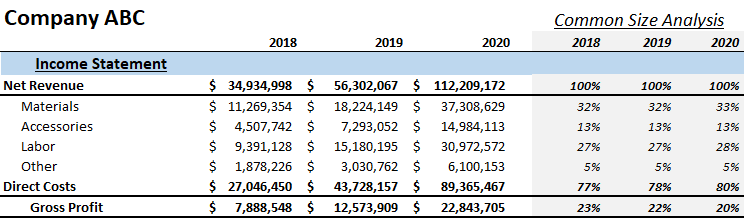
And for the vertical analysis, we will turn ABC’s income statement into a common-size income statement:
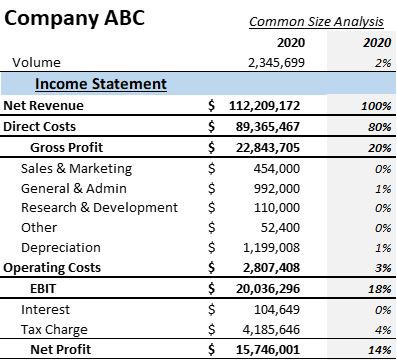
A common-size income statement shows every cost and profit item as a percentage of revenue (simply by dividing each line by total revenue). Profit items from a common-size income statement are also known as profitability ratios.
We can see that every dollar ABC earned as revenue in 2020 costs 80 cents to produce and deliver but then the scale is big enough and the company efficient enough to support the operation with only 3% of revenue as fixed (or operating) costs.
Of course, these examples only illustrate the mechanics of how the analysis begins. A seasoned financial analyst will dig deeper and combine horizontal and vertical analysis:
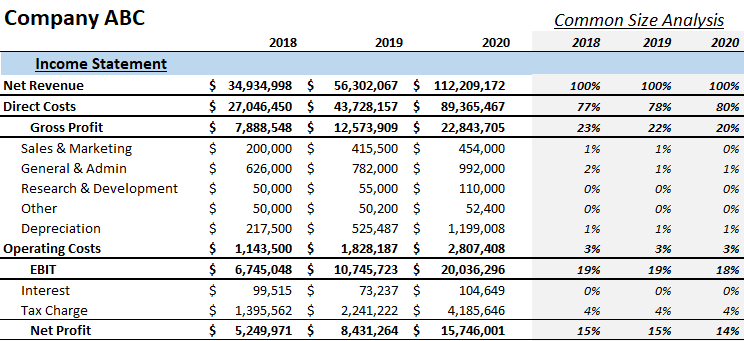
What we can infer from the 3-year period common size income statement:
- Strong revenue growth should suggest that operational (fixed) unit costs should decline; but then operational costs (in this case at just 3% of revenue) are merely a fraction of total costs and so that won’t make much difference.
- On the other hand, we have rising production (variable) costs, which form the bulk of the company’s costs. This doesn’t look good. Perhaps last year’s acceleration of growth came with certain capacity constraints that drove production costs up? This needs to be checked.
- We can also see that R&D and depreciation costs nearly doubled last year, so the firm seems to be investing but the question is, is it investing efficiently? They spent on PP&E but yet, instead of rising productivity, production costs went up. Could there be technological constraints here? A steep learning curve on new machinery?
So, growing revenue, rising costs of production, fairly steady operational costs but declining profitability (as a percentage of revenue), combined with investment in R&D and PP&E. Is this good or bad?
Well, the short answer is – we don’t yet know if these are good numbers or not. What if the industry norm is a 25% operating margin? What if competitors spent double on R&D?
Best practice dictates to always look at the numbers in comparison to industry averages or at the very least to a close competitor.
Fictitious company ABC’s closest competitor happens to be fictitious company XYZ and its common size income statement is shown below (along with the same horizontal analysis):
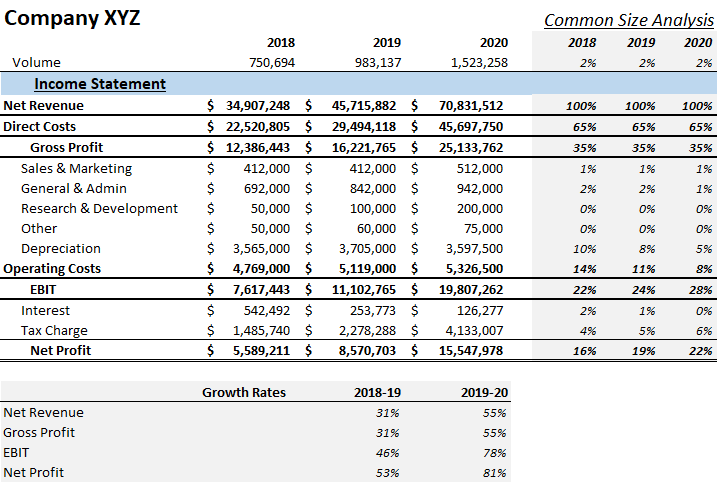
What have we here:
- XYZ’s revenue grew slower but at an accelerating pace. They started with about the same revenues at $35 million; but while XYZ only grew to $71m in 2020, ABC had $112m!
- Note however that XYZ was the more profitable of the two and as it happens it had significantly higher operating and net profit margins in 2020.
- One glance at the common-size income statements reveals that ABC’s direct costs are much higher than those of XYZ and as a result, the latter has a lot more gross profit, which it can use to cover operational costs, to invest in R&D or in marketing, or to redirect to capital expenditures, thus keeping its plant more productive.
- You can compare fixed cost line items and see that XYZ spent more on R&D and on Marketing (in absolute terms) over the last year (and slightly less on general and admin expenses). It could well afford it.
- It is also interesting that depreciation expenses for XYZ are staggeringly higher than ABC’s. Could this be the reason why its gross margins fare that much better? Because it invested more in more productive machines and equipment? Or is it just due to different depreciation methods?
Let’s dig a little deeper:
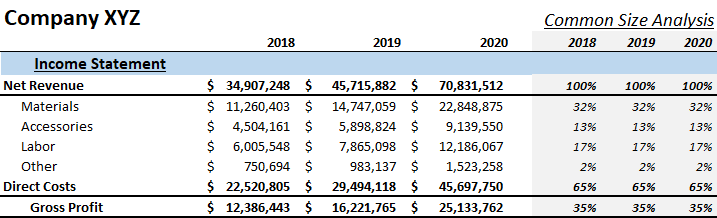
It seems that while materials and accessories have roughly the same weight on revenue, XYZ pays stunningly lower for labor. Other direct costs are also lower (those would usually be warehousing and transportation). So XYZ either pays a lot less in salaries or its productivity is much higher:
- With higher depreciation and higher interest expense, one can easily speculate that XYZ Company borrowed money to purchase more productive equipment and it now needs less workers to produce their product. And that perhaps company ABC has been trying to catch up with it in the last year (as D&A were almost equal in 2020);
- Lower salaries (we’re talking nearly a third lower) are less likely unless they have some sweatshop in, say, Latin America but then transportation costs per item (“other”) should be higher and they are actually lower.
- Lower “other” costs may also indicate that inventory management is better (as they usually include warehousing).
So, we end up with a list of things that need to be checked. And to do that we need to turn to the balance sheet and cash flow statement first. And we’ll start by making them common-size for both companies.
If you want an example of a Common-Size Income Statement in Excel, take a look at our Common-Size Income Statement Excel template.