DuPont Analysis – A Practical Example
Join over 2 million professionals who advanced their finance careers with 365. Learn from instructors who have worked at Morgan Stanley, HSBC, PwC, and Coca-Cola and master accounting, financial analysis, investment banking, financial modeling, and more.
Start for Free
A practical example on DuPont analysis can better reveal the usefulness of the framework and make things clearer.
Let’s look at 2 similar companies:
- Company A runs a rented family hotel and has total assets of $110,545;
- Company B runs a rented family hotel and has total assets of $110,545 (that is not an error).
I will deliberately refrain from looking at the actual financial statements for now (bear with me).
So, both companies have the same asset base and serve the same industry, which makes them direct competitors.
But company B’s owners ended the year almost twice as happy as Company A’s.
ROE{_A}= 33.2% ll 64.4% =ROE{_B}Let’s analyse this by using the DuPont method as already examined.
Step 1 – Decompose ROE
How could Company B, of the same size, bring almost twice the return to its owners?
ROE= \frac{Net~Income}{Avge~Equity}ROE{_A}= \frac{\$24,537}{\$73,824}=33.2\% \qquad ROE{_B}= \frac{\$24,632}{\$38,234}=64.4\%Let’s look into this by dissecting ROE:
ROE= ROA \times Leverage
You would quickly notice that ROE numerators for both companies are virtually the same. So, not only the companies’ asset base is the same but they also managed to earn the same net profit over the past year. This would in turn indicate that:
a) their ROA will be roughly equal:
ROA= \frac{Net Income}{Avge Assets}ROA{_A}= \frac{\$24,537}{\$110,545}=22.2\% \qquad ROA{_B}= \frac{\$24,632}{\$110,545}=22.3\%And of course,
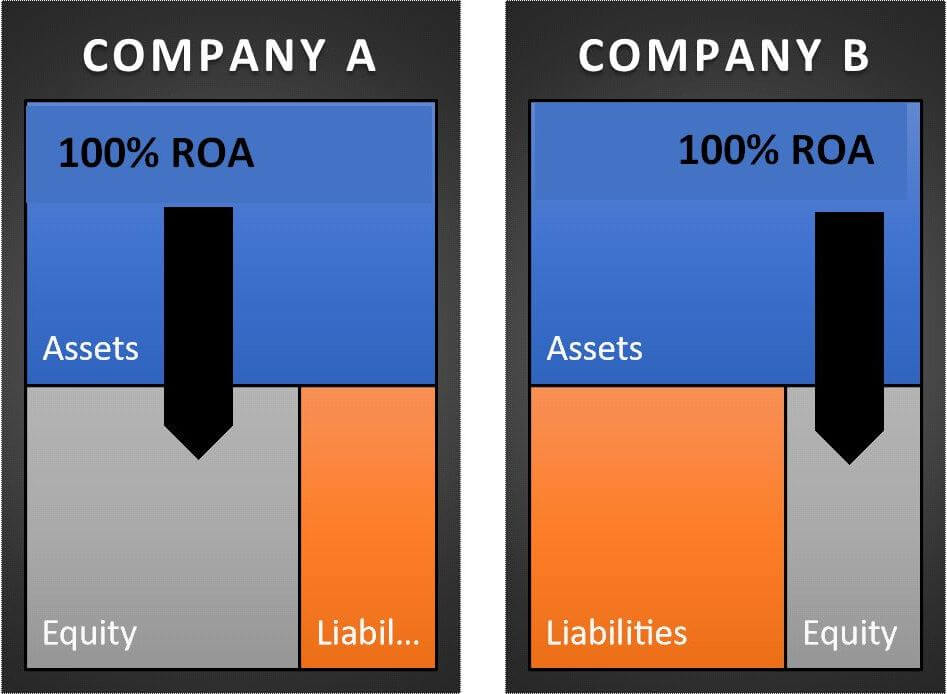
b) the key driver to Company B’s much higher ROE is the fact that the company is nearly twice as leveraged as is Company A.
Lvge= \frac{Avge~Equity}{Avge~Assets}Lvge{_A}= \frac{\$73,824}{\$110,545}=150\% \qquad Lvge{_B}= \frac{\$38,234}{\$110,545}=289\%This may be a riskier financial position but then the return on the company’s assets gets distributed to a much smaller equity stake than is the case for Company A.
So, clearly leverage makes all the difference when it comes to the return on equity both companies enjoy.
Step 2 – Decompose ROA
ROA is the same for both firms but we cannot rely on a simple metric (especially such an important one) and should always try to understand how it was formed.
ROA{_A}= \frac{Revenue}{Avge~Assets} \times \frac{Net~Profit}{Revenue}=\frac{\$164,547}{\$110,545} \times \frac{\$24,537}{\$164,547}=1.49 \times 15\%=22.2\%So, we have a 15% net profit margin and asset turnover of 1.49. That does not tell us much, except that there is some profit (as net profit margin > 0); and that the business is not too bloated with idle assets (as asset turnover > 1).
Let’s compare:
ROA{_B}= \frac{Revenue}{Avge~Assets} \times \frac{Net~Profit}{Revenue}=\frac{\$214,423}{\$110,545} \times \frac{\$24,632}{\$214,423}=1.94 \times 11.5\%=22.3\%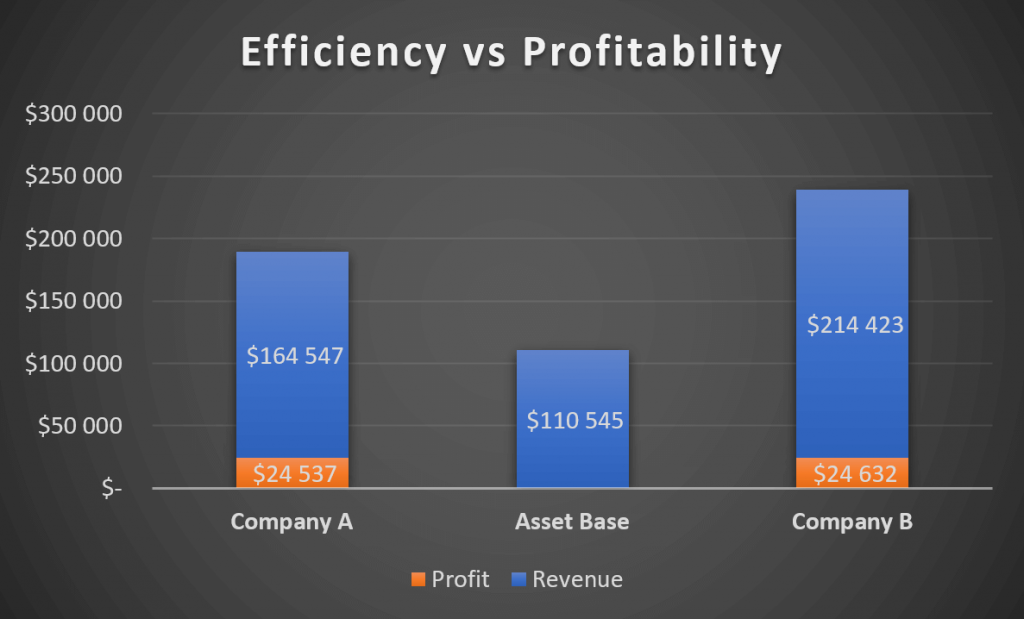
So, evidently company A is more profitable but uses its assets less efficiently.
Company B uses its assets more efficiently and attracts more revenue but is less profitable.
It will be interesting to understand where this comes from. Perhaps Company B does not control its costs well?
Step 3 – Decompose Net Margin
Let’s examine the cost structure of both companies under the DuPont framework:
Net~Profit{_A}= \frac{Net~Profit}{EBT} \times \frac{EBT}{EBIT} \times \frac{EBIT}{Revenue}= \frac{\$24,537}{\$30,293} \times \frac{\$30,293}{\$37,846} \times \frac{\$37,846}{\$164,547}=81\% \times 80\% \times 23\%=15\%This tells us nothing, so let’s compare:
Net~Profit{_B}= \frac{Net~Profit}{EBT} \times \frac{EBT}{EBIT} \times \frac{EBIT}{Revenue}=\frac{\$24,632}{\$31,180} \times \frac{\$31,180}{\$51,462} \times \frac{\$51,462}{\$214,423}=79\% \times 61\% \times 24\%=11\%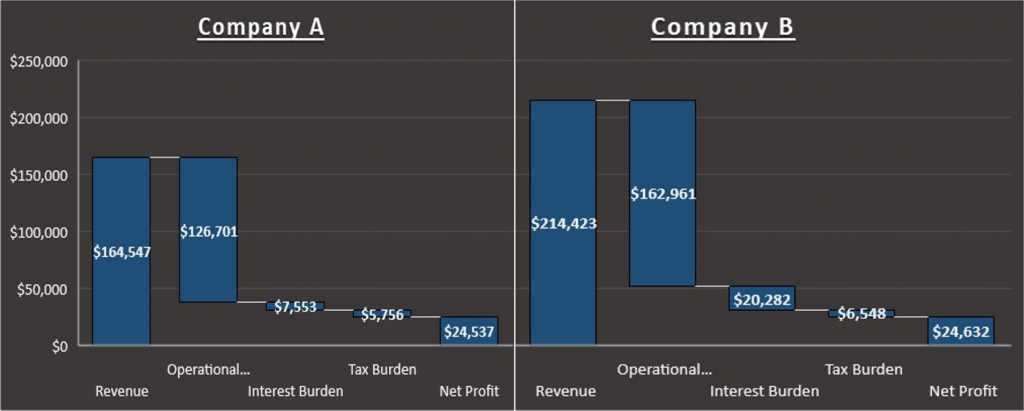
Company B’s interest burden appears to be of a bigger weight but that shouldn’t surprise us because we already knew that the company is heavily leveraged.
The tax burden is fairly equal, which also shouldn’t surprise us since the companies are fairly small and operate within the same jurisdiction.
A really interesting observation though is that their EBIT margins are fairly equal !!
So, it is the interest burden that makes all the difference for Company B’s profitability….
A Classic Risk-Return Trade-Off
I do not know whether Mr Brown came up with DuPont’s model by thinking through the fundamentals of a business or by looking at the equations that form the ratios. I believe that, like most ingenious discoveries, this was a combination of the two. But he surely pinpointed the most important fundamentals of any business:
- Use all of your assets efficiently to attract customers
- Make sure the costs are lower than the revenue
- Leverage it all to increase your returns
- Repeat the cycle
If we look at companies A and B and the progression of DuPont’s analysis we just made, we can see that each has their strengths and weaknesses:
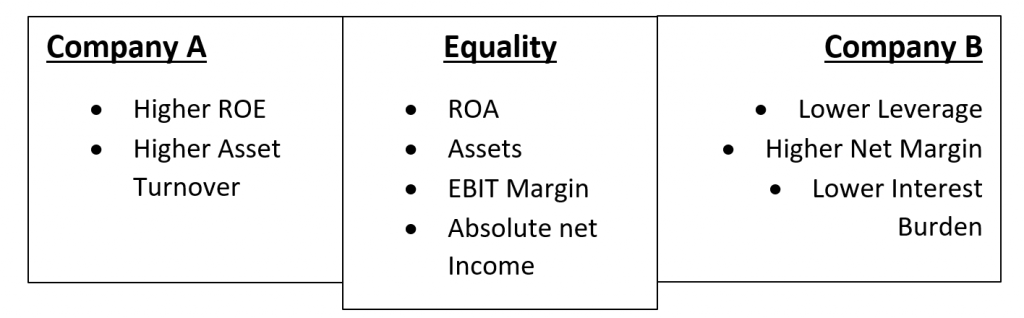
Company B appeared to have the higher ROE but then it turned out to be the more leveraged; and while it seemingly uses this leverage efficiently, it is the less profitable of the two (in relative terms) due to its higher interest burden. The higher return comes with higher risk.
In Conclusion
When it comes to finance, most people tend to think: profit – good, liabilities – bad. If that is the case, then clearly Company A has a lower leverage and a higher profit margin, which makes it the better choice.
Or does it?
In my opinion, the real story here is told by the asset turnover:
- Revenue B is about a third bigger than Revenue A with about the same asset base. Why is that?
- Either Hotel B attracts more customers, or can somehow command higher prices per customer;
- Operating profit margins are the same, so there is hardly evidence of poor operational cost control;
- And a higher turnover with the same EBIT% means that there will be more actual money for Company B at the operational level (i.e. in absolute terms);
- In fact, both companies earned the same absolute amount of net profit ($24.5k);
- Company B’s net profit margins are lower only because of the higher debt burden;
- That makes it a more risky proposition but:
- If it can attract more customers or command higher prices, then it has some competitive advantage, it understands the business better, and has a higher growth potential;
- Plus, from an equity standpoint, there is double the return Company A can offer;
- So, if there is a sufficient degree of confidence in their ability to service their debt, then to me (when judged solely by these numbers) Company B is the clear winner: it has a competitive edge, it is at least as efficient in its operations, and it returns more to its investors.
Of course, what we did here was to greatly simplify a (fictional) case and crunch a few numbers, just for the sake of showing DuPont’s analysis mechanics and usefulness.
There will normally be a lot more to explore with respect to cost structure – fixed costs, variable costs, non-operating costs, depreciation, etc. That will help us see if one business is run better than the other.
And there will be a lot more to explore with respect to assets and liabilities – current assets, cash on hand (should a liquidity emergency arise), fixed assets, liabilities structure, long-term credits, equity structure, etc. That will help us appreciate the liquidity and solvency risks.
Nevertheless, though things are never this simple in real life, DuPont’s framework is still very useful and very applicable.
Of course, there are other analytical tools we can master.
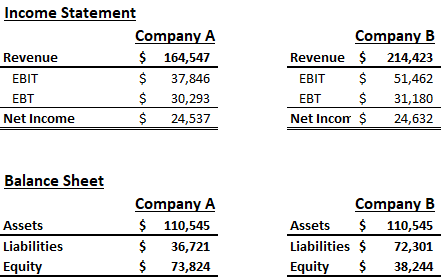
Appendix: Companies A and B financials:
You can download for free an example Excel DuPont model here.