What is a Common-Size Cash Flow Statement?
Join over 2 million professionals who advanced their finance careers with 365. Learn from instructors who have worked at Morgan Stanley, HSBC, PwC, and Coca-Cola and master accounting, financial analysis, investment banking, financial modeling, and more.
Start for Free

Common-size income statements present their line items as a percentage of revenue, common-size balance sheets present their line items as a percentage of total assets. What would common-size cash flow statements compare their line items to?
The Cash Flow Statement
The cash flow statement usually starts with net profit, taken directly from the income statement, and can therefore be described as a continuation of the latter. The key differences between the income and the cash flow statements lie in their treatment of working and fixed capital investment. The income statement takes a more operational perspective of a firm’s activities, whereas the cash flow statement, as the name suggests, deals with the inflows and outflows of cash. These cash flows are split into three main categories:
- Operations – the cash that comes in and goes out due to the firm’s everyday business activities;
- Investment – the cash the company uses to purchase (and more rarely sell) assets;
- Financing – the cash the company receives from and pays back to its external financiers.
Those three cash flows are fairly independent of each other, and so neither a single one of them, nor their net sum can form a meaningful basis for a common-size cash flow statement where all the line items are compared to a single one.
The Value of Common-Size Cash Flow Statements
If the cash flow statement can be framed as a continuation of the income statement, then it would make sense for a common-size cash flow statement to compare all of its line items to revenue.
This helps various stakeholders answer some really important questions about the performance of a business:
- What part of the clients’ money goes to the firm as hard cash?
- Is it enough to sustain the business’ investment activities and cover financing costs?
- What part of it gets reinvested in the business’ assets?
- What part of it is left to equity holders?
- What part of it is used to pay creditors?
- What part of it comes from external financiers and what – from the business itself (operations)?
- Are cash flows consistent and sustainable over time?
A Practical Example
We made a few bold assumptions with respect to ABC and XYZ when we reviewed their common-size balance sheets:
- ABC is a risky player: it grows at the expense of profitability and through M&A.
- XYZ is a conservative player: it grows organically and while smaller it is more profitable and more stable than ABC.
Let’s see if their cash flow statements confirm this.
ABC Cash Flows
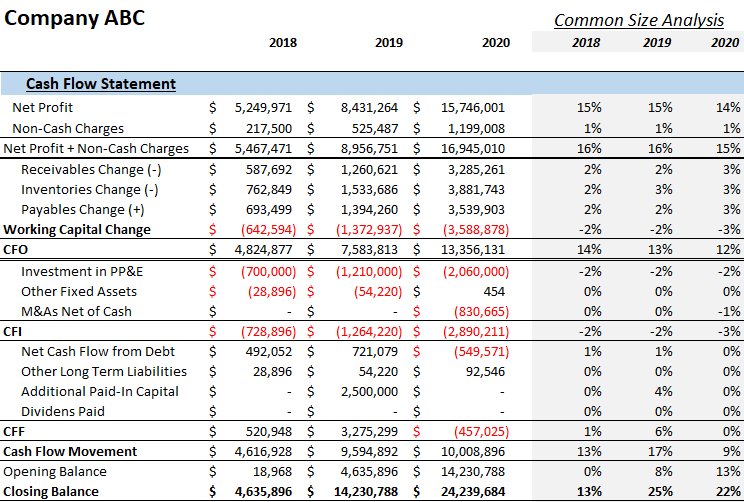
Looking at ABC’s common-size analysis line by line, we see that:
- Net profit is 15% of revenue, and the non-cash charges (read depreciation & amortization) do not appear to make any significant difference. Could that mean that the company’s plant is too old and depreciated?
- Working capital items stand at 2-3% negative (a few minor items are hidden here, which results in different CFO totals). This is typical for companies that produce goods, as they tend to have a longer inventory cycle.
- Cash flow from operations (CFO) is not much different from net income (in relative terms), which implies that the company doesn’t appear to have liquidity problems.
- Investment in PP&E is only 2% of revenue. Now, in absolute terms, it is almost doubling every year but, in relative terms, it is fairly flat and rises along with revenue.
- In 2020, ABC made an acquisition that has brought in some additional PP&E with it. If we subtract $220m goodwill, which we saw on ABC’s balance sheet, we obtain $630m of fair value assets to add (though, what part was inventory and receivables, and what part was PP&E must be checked).
- Debt amounts appear negligible at 1% of revenue. ABC made use of debt in the first two years as it took more debt than it paid back (so it had inflows); in the 3rd year it paid back more than it took (and had outflows). This is a net figure, so it is not clear whether it didn’t take any new debt in 2020 but if it did, it was less than what it paid back to its creditors; and, given its CFO is 26 times the amount of debt repayment, it is certainly nothing to worry about.
- There was a significant external investment in 2019. It is not clear if 4% of revenue can be counted as significant, but it is surely over 3 times the debt taken that year. So, at the very least, we can infer that there is interest from equity investors.
- If investment stays at 2-3% of revenue and CFO is more than 10%, then it looks like ABC is well capable of covering its investment needs without external financing. The big question is – does it appreciate its investment needs? Perhaps, if it invested as efficiently as XYZ, its labor costs would have been much lower, driving profits up.
XYZ Cash Flows
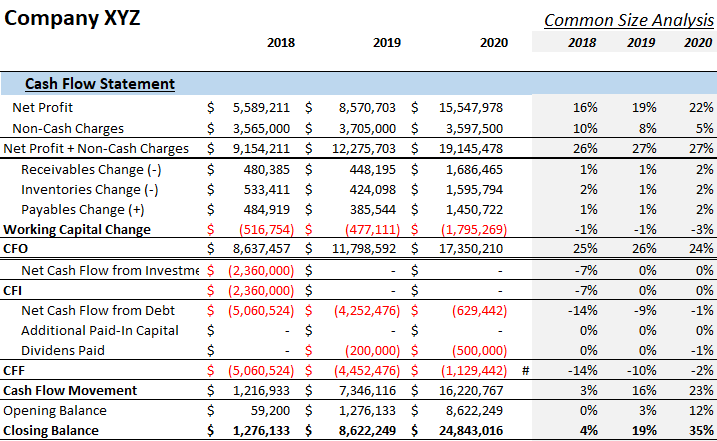
Its figures tell us a very different story:
- CFO looks way better than ABC’s in absolute and in relative terms, profit margins are better, and its working capital accounts are much smaller, which implies superior operating cycle management.
- We already knew both companies had about the same net profit margin 3 years ago and that XYZ grew more profitable at least in relative terms (note that net income amounts are about the same in 2020, roughly $15m).
- We also knew depreciation expense for XYZ was staggeringly higher than ABC’s.
- Now we can see that XYZ invested heavily in 2018 but did not invest a dime into capital expenditures in 2019 and 2020 (which is why its PP&E account depreciated so much, as we saw in its balance sheet). On the other hand, ABC cumulatively invested way more in its PP&E but did it gradually over time. Perhaps the staggering difference in D&A expense comes from using different depreciation methods?
- Note that in terms of financing, it seems that XYZ gradually reduced its debt load and did not take on new debt or equity financing.
- But it did distribute dividends in 2019 and grew them by 150% in 2020 instead of reinvesting profits into the company’s plant. That is a big red flag!
- To sum-up, operating cash flow (CFO) for the last year was $4m more than ABC’s (in absolute terms) but not a penny of it went to capital expenditures (reinvesting in the firm’s future). While ABC was investing heavily in capex (including through M&A’s), XYZ distributed dividends. And, do note, closing cash balances are about the same for both firms.
The Bottom Line
So which company is better?
ABC with its lower profitability and risky growth strategy through M&A?
Or, XYZ with its higher profitability but combined with a heavily depreciated capital base and growing dividends?
With the same net profit and the same cash balance, it looks like ABC invests in its future and its market share and XYZ prefers to siphon the cash away to dividends.
It’s hard to tell just by looking at the statements alone. One needs to try and understand their business strategy, corporate governance structures, the industry itself, their product pipeline, and basically try and figure out what their managements’ plans are.
A good starting point for further investigation would be to read the management discussion and analysis, which should be freely available in their 10-K’s.
Do you wish to take your financial analysis career to the next level?
Enroll in our Fundamentals of Financial Reporting course and learn how to read, interpret, and analyze financial statements! To upgrade your skills as a whole, you can take the Financial Analyst Career Track, covering essential topics and told by industry experts.
If you want an example of a Common-Size Cash Flow Statement in Excel, take a look at our Common-Size Cash Flow Statement Excel template.