What is a Common-Size Balance Sheet?
Join over 2 million professionals who advanced their finance careers with 365. Learn from instructors who have worked at Morgan Stanley, HSBC, PwC, and Coca-Cola and master accounting, financial analysis, investment banking, financial modeling, and more.
Start for Free

The concept of a common-size balance sheet is much the same as that of the common size income statement but here, we take all the line items, on both the asset and liabilities sides as % of total assets. The idea is to eliminate size differences between companies as well as to get an insight into the financial position and capital allocation of the business.
Of course, given that a balance sheet is only a snapshot of a company’s financial position at a certain point in time, we would prefer to look at its balance sheets for a few years back, so we can see how it evolved over time and is it doing better or worse at present. And, just like with the income statement, we must compare our numbers with the industry’s averages or with major competitors.
Let’s carry on with our analysis of ABC, in comparison to its competitor XYZ.
We’ll go straight to the full 3-year common size balance sheet of ABC.
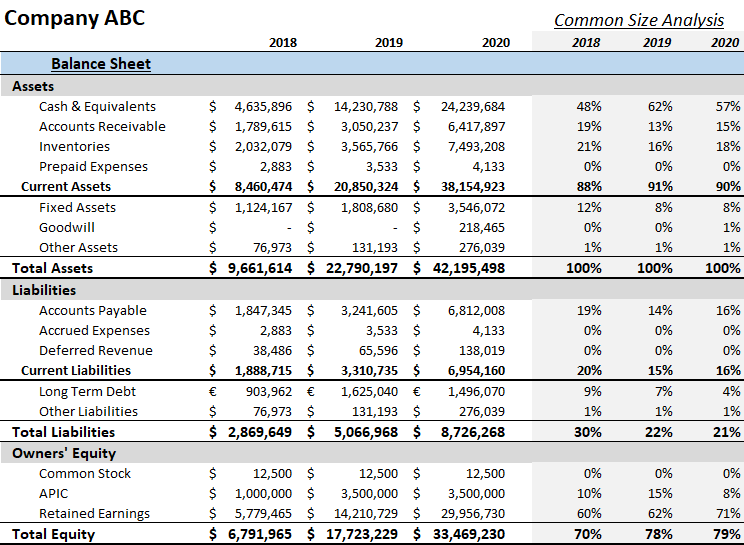
As already explored in our common size income statement article, best practice is to compare with a competitor, but let’s first see what draws our attention here:
- What stands out on the asset side is that cash & equivalents is a huge account. One doesn’t even need to look at industry norms here: over 50% of ABC’s assets are cash.
- Now, the good news is that a correspondingly large account on the liabilities side is not related to external financing but represents retained earnings.
- So that tells us that the company generates a lot of cash but also implies that its management doesn’t seem to know what to do with it:
- Is it safe from a liquidity and solvency perspective? Most definitely (and we shall review those ratios soon).
- Is it a good company to invest in? Perhaps. We need to find out whether ABC’s management has some plans to deploy all this cash to productive use.
- ABC took on some external financing in 2019: a mixture of debt and equity. Its long-term debt account nearly doubled and its additional paid-in capital (APIC) account more than tripled.
- And one can also see that in 2020 it doubled its fixed assets and recorded some goodwill. Now, the appearance of goodwill can only mean one thing: acquisition. And that fits tightly with the steep revenue growth ABC saw in 2020. It seemingly acquired a company and got its assets and its revenue.
- So, with this much cash on hand, one can then speculate that perhaps ABC is preparing to expand further by mergers & acquisitions.
- Other than that, debts do not seem to be a problem as they have decreased to just 4% of company’s assets.
- Working capital accounts appear to be decreasing as well. Inventory account rose in 2020, which may be indicative of certain operational inconsistencies between ABC and the newly acquired company; it is something to investigate but it certainly doesn’t look drastic enough to ring any alarm bells. Certainly not with all this cash on hand.
What does XYZ’s balance look like?
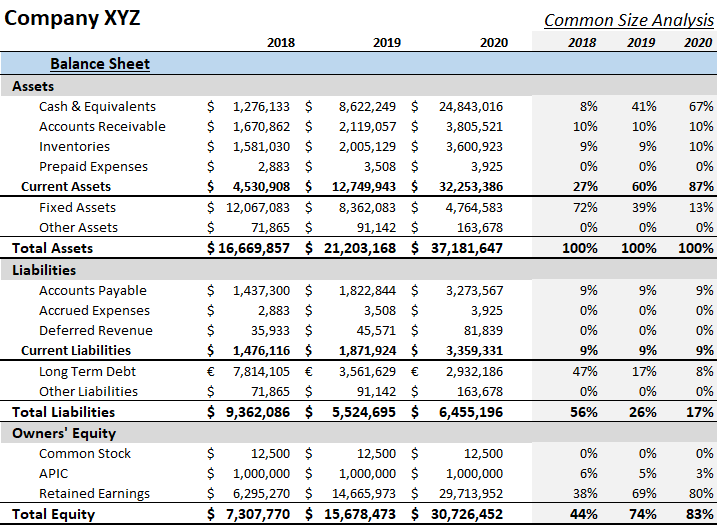
What does this tell us?
- It looks like both companies are cash-generating machines and I would be very interested to see their cash flow statements.
- It is easy to see they have different financing and growth strategies:
- XYZ started 2018 with a lot of debt (almost 50% of assets, as opposed to 10% for ABC) and a much smaller equity account (except for retained earnings).
- There is also no goodwill account, so the company has most likely grown organically.
- It appears to be managing its operating cycle better, given that its working capital accounts are a smaller percentage of assets than are ABC’s (circa 10% vs. north of 15% for ABC).
- But its plant has depreciated significantly, compared to the start of the period and this is evident in both absolute and relative terms. We could infer from its low labor costs that they most likely maintain a productive PP&E but it is apparently time-consuming to reinvest in it.
So which company is better?
Well, it seems to me that ABC is a more risky investment because:
- It has (much) lower and declining profitability;
- It seems to be going for rapid expansion but it is not clear it has the capacity to match this revenue growth;
- Expansion through M&A, while quicker, comes with its own problems (90% of them tend to be failures)
XYZ has stability and better profitability, so seemingly it may be a better long-term alternative.
That said, companies often trade profitability for market share and, if successful, the rapid expansion of ABC can put the seemingly more conservative XYZ in a difficult position simply by becoming a larger competitor. ABC’s profitability may be lower, but its cash generation abilities cannot be questioned and so bankruptcy risk will be minimal and there will be no shortage of investors trying to get in on the action. And there is no reason ABC cannot reach XYZ’s labor costs over time, which would immediately drive profits up.
Let’s look at their common-size cash flow statements!
If you want to find out how to prepare a Common-Size Balance Sheet in Excel, take a look at our Common-Size Balance Sheet Excel template.