What is Profitability Index?
Join over 2 million professionals who advanced their finance careers with 365. Learn from instructors who have worked at Morgan Stanley, HSBC, PwC, and Coca-Cola and master accounting, financial analysis, investment banking, financial modeling, and more.
Start for Free
The profitability index (PI) is used to assess how much profit may come from a particular investment. Although not that common among finance professionals, as opposed to NPV and IRR, it is still considered economically sound. Governments and NGOs normally use this index when performing capital analysis.
Profitability Index Formula
The Profitability Index (PI), also known as Value Investment Ratio (VIR), expresses the relationship between the discounted inflows and invested amounts, or costs, for a given project. We can think of PI as the discounted value a project returns for one unit of currency invested. The formula to calculate it is as follows:
PI=\frac {PV~of~future~cash~flows}{Initial~Investment}=1+\frac {NPV}{Initial~Investment}Where “PV of future cash flows” is the present value of cash flows, starting from period 1 until the end of the project, and NPV denotes the Net Present Value. Note that PI results are based on estimates rather than precise numbers taken from a firm’s major financial statements. Discounted cash flows may unexpectedly differ in the future, which immediately makes us question the predictive accuracy of both PI and NPV figures as stand-alone metrics. To build solid decision-making criteria for investments, we often combine it with other ratios.
How Do We Interpret the Profitability Index?
The Profitability Index represents a ratio between the discounted profit and the initial investment. That said, a result of exactly 1.0 would be equivalent to a break-even, where NPV = 0. A ratio above 1.0 would mean that a venture returns a profit above its required investment, and thus has a positive NPV. With a PI below 1.0, on the other hand, a project is likely to destroy shareholder value, hence its NPV would be negative. So, the PI rule looks as follows:
Accept if PI > 1.0
Reject if PI < 1.0
In fact, PI will give us the very same conclusions as the NPV technique, only if we evaluate a single project. Examining and ranking multiple ventures, however, require you to treat the results with caution. That’s because the PI result simply ignores the projects’ scale and the absolute added shareholder value. Consider a project that costs $10 and has a $20 present value (Investment 1), and another one (Investment 2) that costs $1,000 with a $1,500 present value.
In Investment 1: NPV = $10 and PI = 2
In Investment 2: NPV = $500 and PI = 1.50
Should these be mutually exclusive investments, the second project will be preferable, even though it has a lower PI. This is how, if examined in isolation, PI ignores the size and added shareholder value of a given project.
Example of Profitability Index
Suppose that you have to rank two mutually exclusive ventures. Cash flows are expected to be as shown below:
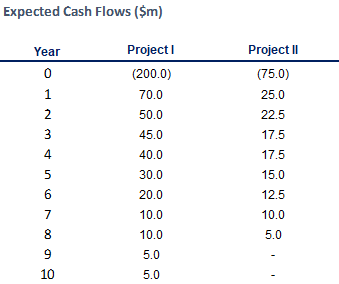
The first thing you notice is that Project I has a larger scale compared to Project II — it requires larger initial investment and returns higher cash flows. The first project will return cash flows for a period of 10 years, while the second one is expected to deliver for 8 years only.
You are asked to estimate the added value of each project, and you decide to use the Profitability Index. You will be calculating it in MS Excel.
You start by choosing the appropriate discount rate for those projects. Both of them bear the same level of risk, and a 5% discount rate is appropriate. Recalling the PI formula, you then go ahead and calculate the NPV:
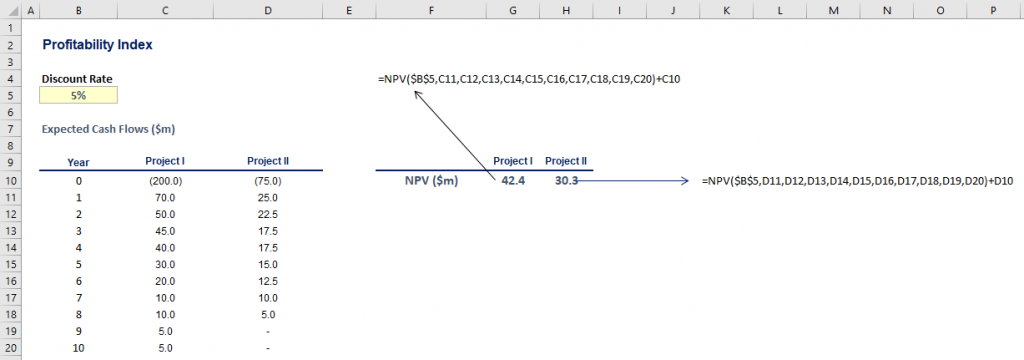
We obtained $42.4 million for the first venture, and $30.3 million for the second investment. On the grounds of the positive NPV figures, we consider both projects to be acceptable.
At the next stage, you incorporate the NPV result in the PI formula by dividing the NPV by the value of the outlays from the null period and add 1, as shown below:
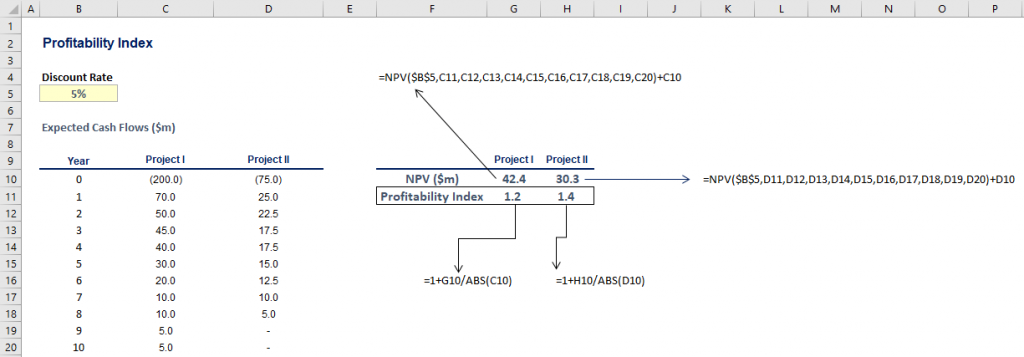
In the end, Project II has a higher PI than Project I.
Project II returns $1.4 million for each $1 invested, whereas Project I yields $1.2 million. This implies that the second venture is more efficient in terms of 1 unit of currency invested. However, the NPV figures tell us that Project I adds more total shareholder wealth (42.4 > 30.3), and should thus be preferred over Project II.
Advantages and Disadvantages of the Profitability Index
The Profitability Index helps evaluate how attractive a project is. Some of its key advantages include:
- It is economically sound, as it considers the time value of money.
- It yields the same conclusion as NPV when evaluating a single project.
- It measures the value created per dollar invested, so it can be used as a guide in capital rationing.
Nevertheless, special attention needs to be paid to the following pitfalls of this technique:
- It ignores projects’ scale and absolute added shareholder value.
- Like NPV, it is based on estimates.
- It requires you to calculate the NPV, which further complicates the calculations.
The Bottom Line
The Profitability Index is a useful technique in the analysts’ toolbox. It may not always indicate the correct decision when ranking projects but would certainly provide an insight into the cost-benefit efficiency of one monetary unit invested. Despite its relevance, this index uses just an estimate of the cost of capital in its calculation, so it should not be reviewed on a stand-alone basis. Combined with the Payback Period, Discounted Payback Period, and the Accounting Rate of Return, this ratio provides meaningful data to work with.
Make sure you keep reading our articles to find out more about the various capital budgeting ratios!
If you want to find out how to calculate the Profitability Index in Excel, take a look at our Profitability Index Excel template.