NPV in Excel
Join over 2 million professionals who advanced their finance careers with 365. Learn from instructors who have worked at Morgan Stanley, HSBC, PwC, and Coca-Cola and master accounting, financial analysis, investment banking, financial modeling, and more.
Start for Free

Net Present Value can be used as an indicator of profitability in shareholder wealth derived from a project. Quite often, analysts use the NPV to rank different ventures in the capital budgeting process.
What is NPV?
Net Present Value represents the discounted future cash inflows minus discounted future cash outflows, or simply the discounted future net cash flows. The formula to calculate NPV is as follows:
NPV=-Outlay +\sum_{t=0}^N \frac{CF_{t}}{(1+r)^t}The term CF_{t} is the expected net cash flow at time t, N is the projected life of the investment, and r is the discount rate (also known as the opportunity cost of capital). The NPV rule to accept or reject a project is:
- Accept, if NPV > 0
- Reject, if NPV < 0
Simply said, a venture adds shareholder value when NPV is above 0 and destroys value when NPV turns out to be a negative figure.
How Do You Calculate the NPV?
First, we have to select the appropriate discount rate (r). After that, we take the initial investment amount (outlay) which is usually a negative figure. The next step is to discount each net cash flow separately, and then sum it all up.
We could take a pen, a piece of paper, and a calculator to deal with NPV the old-fashioned way. However, this may be a rather time-consuming and prone-to-errors task, especially when we have a project with numerous periods and a limited time. That’s why most people prefer using MS Excel to calculate the NPV.
How Do You Calculate NPV in MS Excel?
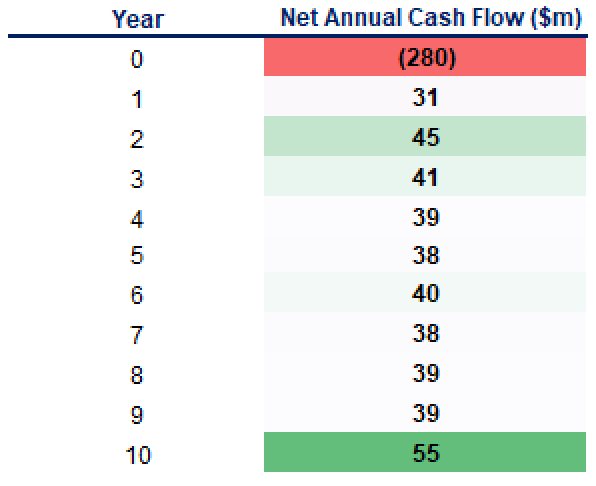
Suppose that you need to calculate the NPV of a 10-year project with an initial outlay of $280 million. You have already forecast the expected net annual after-tax cash flows for each period as presented below. So, what’s next?
To derive the NPV figure, we will consider two common approaches performed in Excel.
Method #1
Here, we will demonstrate two approaches to deriving the Net Present Value. The first method follows the standard NPV formula presented above. We roughly break down the process into three steps:
Step 1: Pick the appropriate discount rate for this project.
Let’s say that 6% is chosen as the appropriate discount rate for the venture. We recommend placing it in a separate cell, so you could easily refer to the discount rate when using the formulae.
Step 2: Discount each cash flow separately.
Add a column next to the cash flow table and use the space to discount these cash flows. We do that in column D (as shown below):
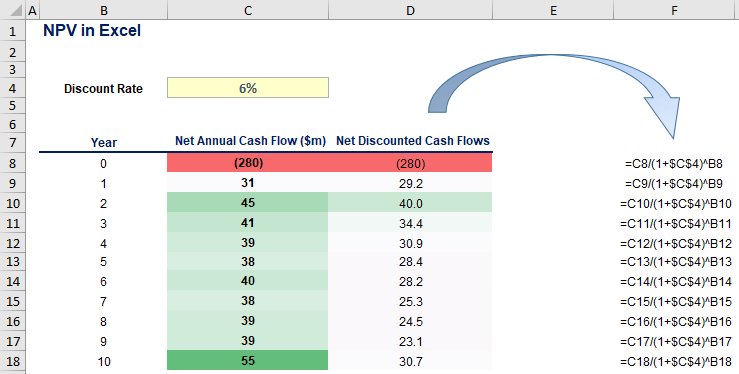
Note that the absolute value of each future cash flow was reduced when we applied the discounting technique. The only exception to this is the $280 million initial outlay that we pay at present.
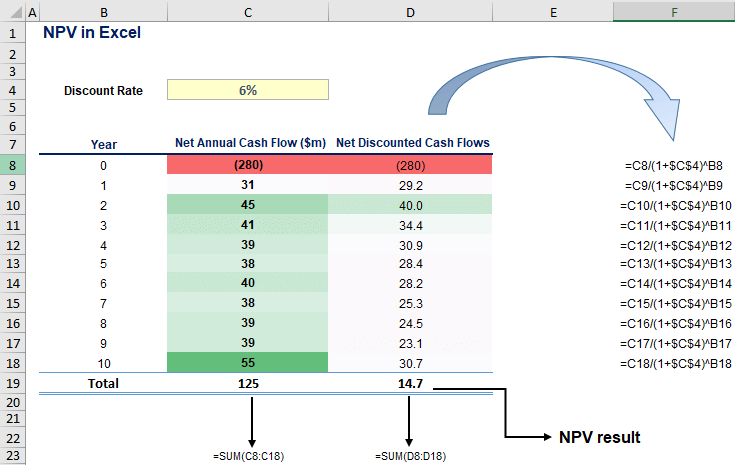
Step 3: Sum up the discounted cash flows.
By summing up the net discounted cash flows (see column D below), we obtain a Net Present Value of 14.7 $ million. According to the NPV rule, the project should be accepted because 14.7 > 0, and thus it adds shareholder wealth.
Method #2
The second way to calculate NPV offers a more direct approach, as opposed to the first method. It focuses on the NPV formula embedded in MS Excel. We follow four simple steps:
Step 1: Choose an appropriate discount rate.
We already chose 6% as the discount rate at which the cash flows should be discounted.
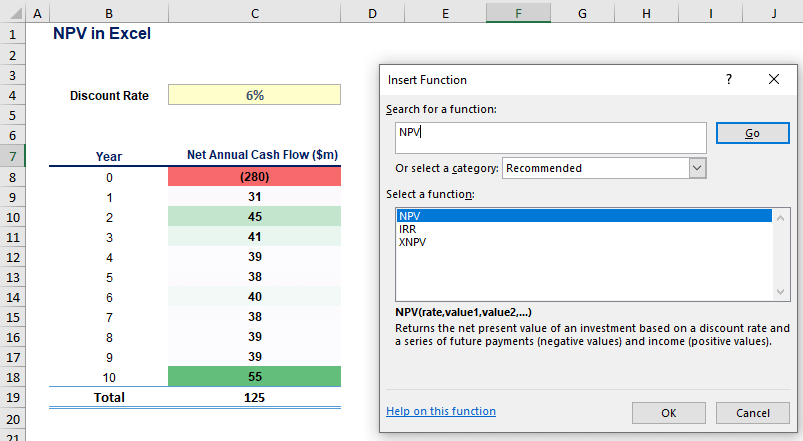
Step 2: Find the NPV formula in Excel.
Use the Insert Function to find the NPV formula (circled in blue).
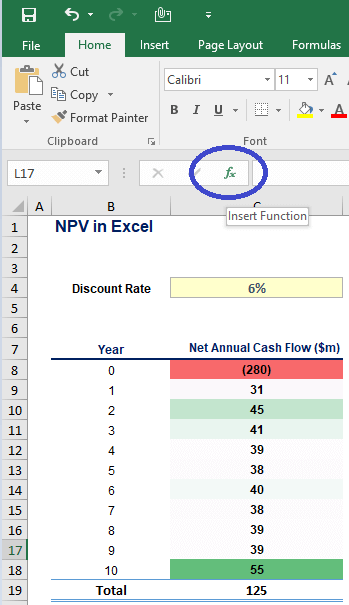
Next, you click on fx and type “NPV” in the “Search for a function” section. Hit go and double-click on NPV:
Step 3: Input the right figures.
First, you are asked to enter the discount rate, so you might refer directly to cell C4 (6%). On a side note, you should remember not to discount the value for the null period. So, starting from Year 1, you then input each net annual cash flow in chronological order and press OK.
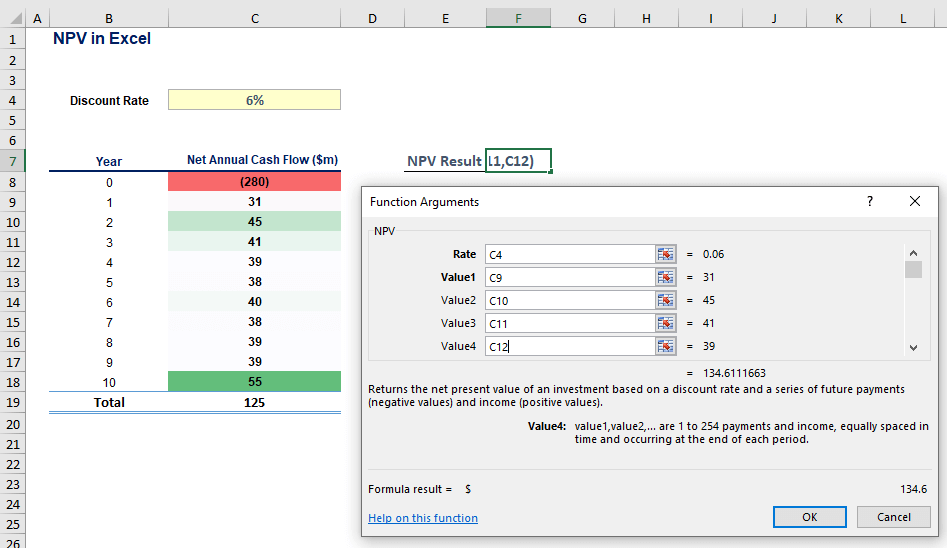
Once we’ve inserted the data, we arrive at the present value of all cash flows for periods 1-10, discounted at 6%.
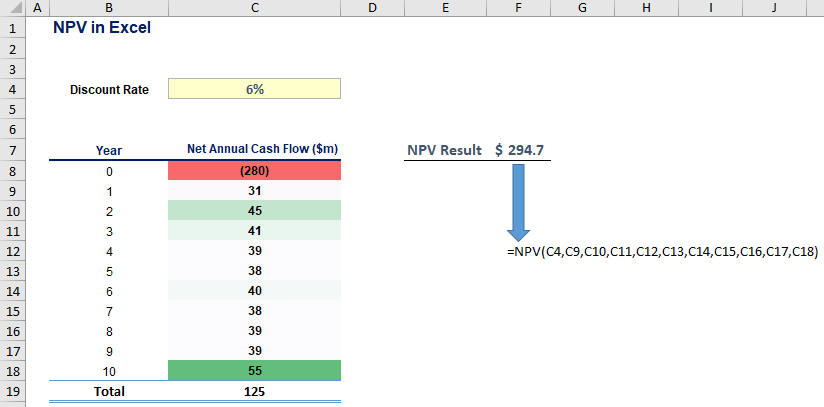
However, we have not accounted for the initial investment of $280 million yet. This is what we do in the last step.
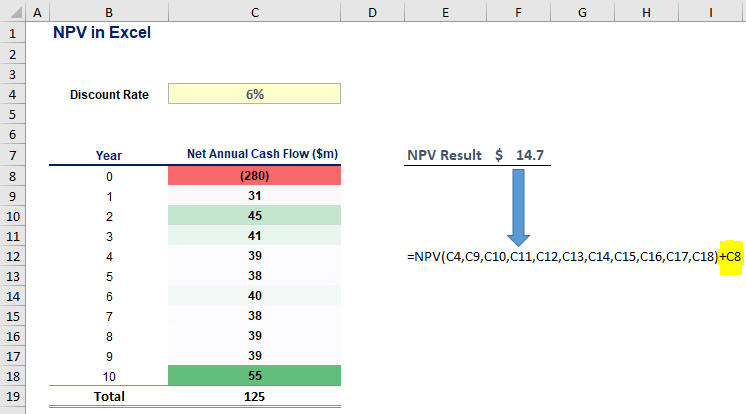
Step 4: Add the initial outlay.
We simply add the value from cell C8 (-280 $million) to the calculation. Ultimately, both methods yield the same result:
Beyond Net Present Value
When analysts make investment decisions, they use a comprehensive set of measures to evaluate a venture. Along with IRR, NPV is a widely known technique to estimate the value that a project adds to a given company. Using MS Excel in calculating the Net Present Value makes analysts’ work more efficient, accurate, and less prone to errors. We presented two different methods for obtaining it, but one could easily come up with another arrangement.
As complementary decision criteria, financiers often perform four additional measures:
- The Payback Period (PB)
- The Discounted Payback Period (DPB)
- The Average Accounting Rate of Return (AAR)
- The Profitability Index (PI)
Make sure you keep reading our articles to find out more on how to apply MS Excel in the capital budgeting process!
If you want an example of NPV in Excel, take a look at our NPV Excel template.