What is the Discounted Payback Period?
Join over 2 million professionals who advanced their finance careers with 365. Learn from instructors who have worked at Morgan Stanley, HSBC, PwC, and Coca-Cola and master accounting, financial analysis, investment banking, financial modeling, and more.
Start for Free

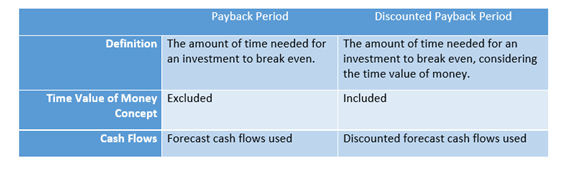
The Discounted Payback Period (DPBP) is an improved version of the Payback Period (PBP), commonly used in capital budgeting. It calculates the amount of time (in years) in which a project is expected to break even, by discounting future cash flows and applying the time value of money concept.
The Discounted Payback Period in Practice
One of the major drawbacks of the Payback Period (PBP) is that it does not consider the opportunity cost (also referred to as the discount rate or the required rate of return). The Discounted Payback Period overcomes this weakness by using discounte cash flows in estimating the breakeven point.
In a way, the Discounted Payback Period is consistent with the Net Present Value calculation in relying on a discount rate to evaluate a project. In reality, if a project returns a negative Net Present Value, it is highly unlikely for it to have a discounted payback time. Unlike the NPV, DPBP is not a yes/no tool for accepting a project; rather, it is a tool to rank projects and to measure the payback time.
Example of Discounted Payback Period
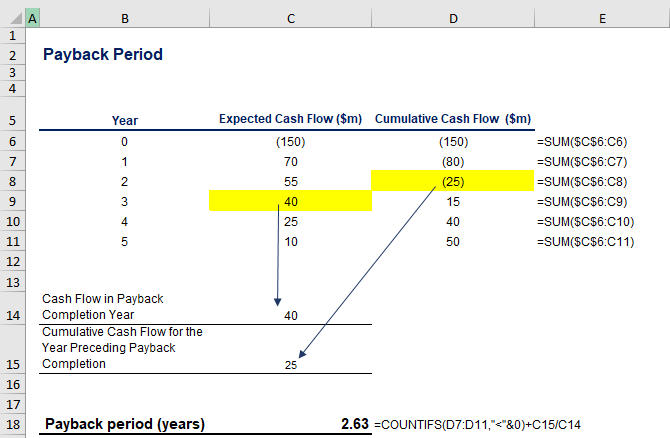
Suppose that you have been assigned to evaluate the economic benefits of a new project. You have calculated the expected after-tax operating cash flows to be $70m, $55m, $40m, $25m, and $10m for years 1-5 respectively, with $150m initial investment. Using MS Excel, you have already estimated that it would take 2.63 years to recover the investment, given the undiscounted cash flows:
However, one of the managers evaluating the investment notices that the opportunity cost at the company level is 6.5% and, as the project is considered riskier compared to otherwise similar ventures, a discount rate of 8.5% should be applied to the evaluation of the payback time. You are asked to take this information into account.
To calculate the discount payback period, you follow four simple steps, which can be easily reproduced in MS Excel:
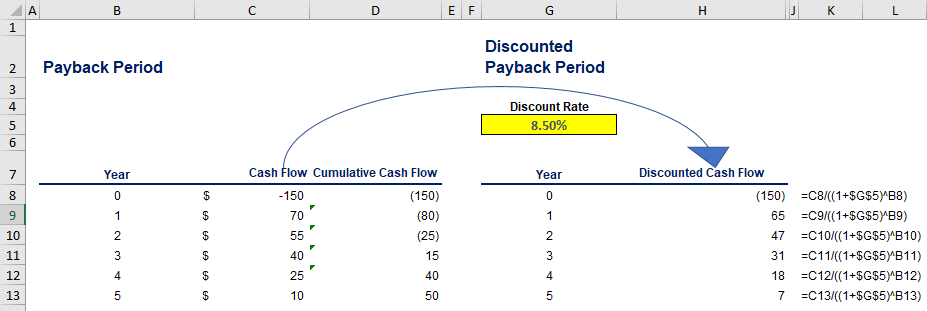
Step 1: Discount the cash flows by using the following formula:
\frac {CF{_n}}{(1+r){^n}}where CF is the Cash Flow for the respective nth year, and r is the opportunity cost of capital.
As presented below, in our calculation of the Discounted Payback Period, we discount the initial cash flows (originally found in column C) in column H.
Step 2: Calculate the cumulative cash flows at each time interval.
Add an auxiliary column to the table (column I) where you will sum up the accumulated cash flow at each time interval.
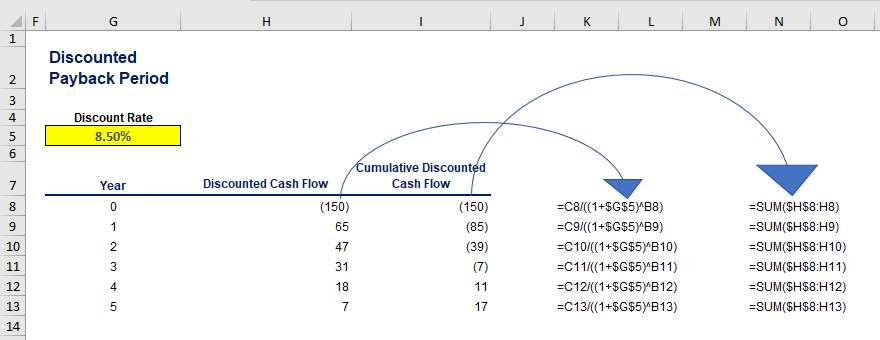
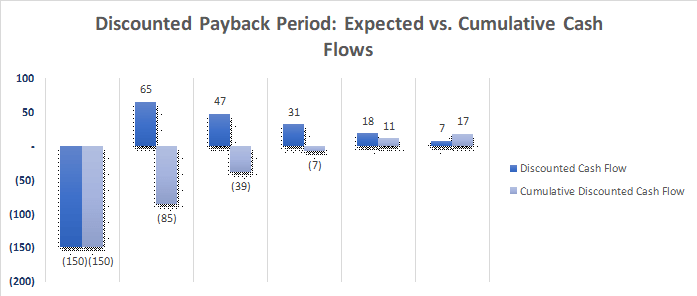
Step 3: Find the last year in which the amount is still a negative figure.
As you see on the graph below, the cumulative cash flow turns positive at some point between the third and the fourth year, which implies that it takes 3-years and “something” to recover the initial investment. We will approximate the fraction of the year in the next step.
Step 4: Estimate the fraction of the year in which the amount is recovered.
The cumulative discounted cash flow at the end of the 3rd year is $7.4m, and the discounted cash flow in the next year is projected to be $18m. Thus, we divide 7.4 by 18 to approximate the 3 years and “something” result.
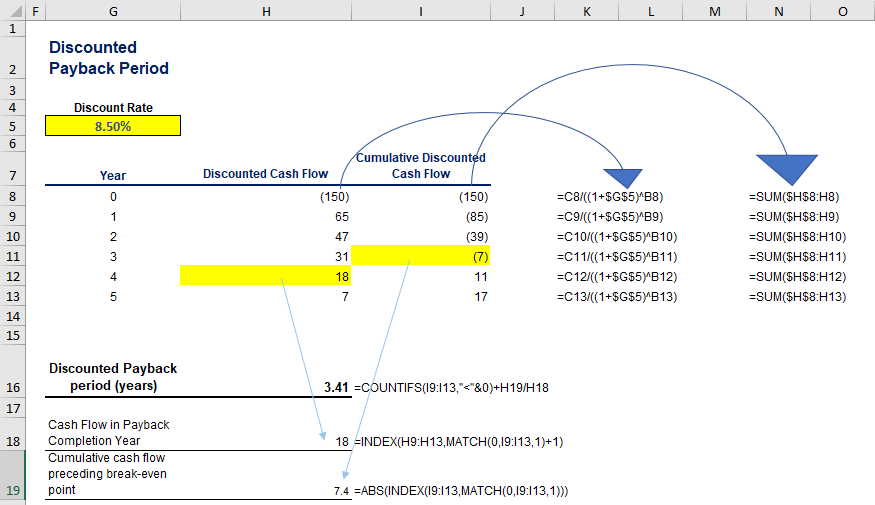
In the end, we estimate that it would take 3.41 years (approximately 3 years and 5 months) to recover the initial investment if we consider the opportunity cost of capital, as opposed to 2.63, if we do not apply the time value of money concept. That being said, the payback time rose by ~0.8 years when we decided to discount the cash flows!
Discounted Payback Period vs. Payback Period
Same as the Payback Period (PB), The Discounted Payback Period allows us to rank the liquidity of different projects – those with lower estimated payback time should be perceived as more attractive and liquid.
It also turns the most obvious drawback of the Payback Period technique (excluding the time value of money) into an advantage, as it discounts the cash flows, making it economically sound.
Nevertheless, there are a few disadvantages one should keep in mind.
The major advantage of the PB lies in its simplicity; however, the DPBP calculation is a bit more complex to compute because of the discounted cash flows. Those without financial background may experience difficulties in comprehending it.
Similar to the Payback Period, the technique omits time intervals beyond the breakeven point. Thus, material cash flows beyond the payback time are not considered and other techniques, such as NPV or IRR, should complement the Discounted Payback Period analysis.
A word of caution! In case we decide to differentiate between risky projects by applying project-specific discount rates, we should be careful in choosing the discount rate for each venture. At the end of the day, the Discount Payback Period relies on the opportunity cost of capital, so picking an appropriate discount rate will make a significant difference in your analysis.
Beyond the Discounted Payback Period
The Discounted Payback Period is perceived as an improvement to the Payback Period. One should understand the payback time well, before diving into the DPBP. Due to the complexity of its nature, professionals believe it is the better way to evaluate ventures as opposed to the Payback Period.
Generally, there are a few commonly accepted corporate finance approaches to assessing the economic benefits of a project. These may include:
- Payback Period (PBP) / Discounted Payback Period (DPBP)
- Internal Rate of Return (IRR)
- Net Present Value (NPV)
In practice, these techniques are jointly used when making an investment decision. To learn more about corporate finance models and techniques, read the recommended articles we have in store for you!
If you want to find out how to calculate the Discounted Payback Period in Excel, take a look at our Discounted Payback Period Excel template.