Liquidity Ratios – Definitions, Types, Formulas
Join over 2 million professionals who advanced their finance careers with 365. Learn from instructors who have worked at Morgan Stanley, HSBC, PwC, and Coca-Cola and master accounting, financial analysis, investment banking, financial modeling, and more.
Start for Free

Liquidity ratios are important indicators of a firm’s short-term financial health. They reveal its ability to convert assets into cash quickly to cover current debts without raising external capital. And although they do not provide meaningful insights about businesses’ long-term standing, they are among the first metrics you should check when making investment decisions.
Identifying companies with low liquidity can save you from poor investment decisions. A good liquidity ratio does not guarantee success, but a bad one is a sign of trouble. Remember the Lehman Brothers’ bankruptcy—one of the most significant financial calamities in modern times? Liquidity problems were to blame.
This article covers everything you need to know about liquidity ratio analysis, including:
- Liquidity ratios definition
- Examples of liquidity ratios
- Formulas
- Usages
What Are Liquidity Ratios?
Liquidity ratios measure businesses’ ability to cover short-term debt timely and without losses. In other words, it reveals how often a firm’s current assets—easily converted into cash—can cover its current liabilities, i.e., financial obligations due within a year.
So, what is a good liquidity ratio?
High liquidity ratios indicate that a firm’s liquid assets exceed its short-term debt. Low ratios signal that it doesn’t have sufficient funds to cover its obligations without raising external capital. The latter may lead to bankruptcy.
How to Calculate Liquidity Ratios
We calculate all types of liquidity ratios by dividing a firm’s current assets by its liabilities. The only difference in the formulas is that some multiples exclude certain assets that aren’t as easily converted to cash.
All liquidity ratios can be derived using the information in a company’s Balance Sheet. So, before we move on to the calculations, let’s review what it contains.
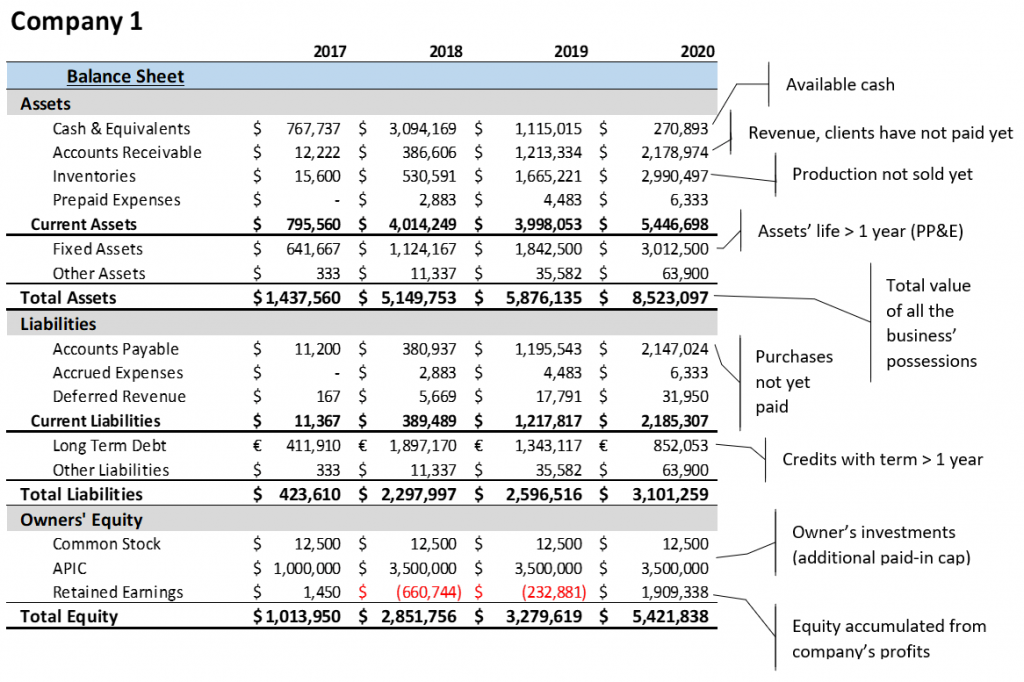
Types of Liquidity Ratios
Liquidity concerns the short term, and liquidity ratios are obtained from the current portion of assets and liabilities. An analyst can make combinations between assets and liabilities depending on the industry under review, the business’s nature, and the analysis’s purpose. Most practitioners consider the following Balance Sheet liquidity ratios as the most insightful.
- Current ratio
- Quick ratio
- Cash ratio
- Defensive interval
Current Ratio
The current liquidity ratio reflects the company’s ability to cover its short-term obligations by comparing the total current assets to the total current liabilities from a firm’s Balance Sheet.
Current~ratio=\frac {Total~current~assets}{Total~current~liabilities}The higher the current ratio, the better the liquidity position of a firm. A good current ratio implies the company can cover its short-term obligations by liquidating its assets. By contrast, a current ratio below 1 is a red flag that a firm can be quickly rendered unable to pay its bills and pushed into insolvency.
The issue with this simple and intuitive measure is that not all current assets are liquid. Prepaid expenses, for example, cannot be liquidated. An inventory’s book value is rarely the same as its market value—certainly not when one needs to liquidate it urgently at fire-sale prices. That’s why experts introduced the quick ratio in liquidity analysis.
Quick Ratio
Are there enough quick assets to meet short-term obligations if a firm faces a sudden liquidity crisis? The quick ratio answers this question. The quick ratio (or acid test) deals with current assets that are quick to liquidate, such as cash, marketable securities, and accounts receivable.
Quick~ratio=\frac {Cash+Marketable~securities+Accounts~receivable}{Total~current~liabilities}The higher this liquidity ratio, the more comfortably a company can face adverse liquidity events.
Cash Ratio
Should the need arise, does the firm have enough cash to cover its short-term obligations? The cash ratio reveals whether a company can meet its obligations quickly. Marketable securities are also included because they are as quick to liquidate as a bank deposit.
We calculate this liquidity ratio with the following formula:
Cash~ratio=\frac {Cash+Marketable~securities}{Total~current~liabilities}Generally, the higher the ratio, the better equipped the firm is to face disastrous events. But remember that this metric is rather conservative and must be taken with a pinch of salt. A result greater than 1 may sound like good news from a liquidity standpoint, but it bears scrutiny on efficiency.
A high cash ratio may indicate that management cannot utilize the business’s cash and struggles to find investment and growth opportunities. And a cash ratio below 1 is not necessarily bad news—especially if the firm has short credit terms with clients, efficient inventory management, and a short net trade cycle.
The Defensive Interval
The defensive interval looks at the company’s quick assets as an emergency cash deposit. In other words, it assesses the firm’s ability to cover its daily expenses in a sudden loss of income. This liquidity ratio reveals how long the company could keep running if it stopped receiving income.
Like activity and ROI ratios, the defensive interval takes items from the Balance Sheet and the Income Statement. To obtain it, we calculate a company’s average daily cash expenses by taking its annual expenses minus non-cash charges like depreciation and dividing them by 365.
Average~daily~cash~expenses=\frac {(Annual~COGS+Annual~operating~expenses - Non–cash~charges)}{365}We then divide the quick assets by the average daily cash expense to obtain the number of days those quick assets can cover.
Defensive~interval=\frac {Cash + Marketable~securities + Receivables}{Average~daily~cash~expenses}The higher the ratio, the longer the company can survive without income, external financing, or long-term assets.
While this is the universally accepted formula for this liquidity ratio, there can be different iterations depending on the circumstances. For example, we can include interest and principal payments from the cash flow statement since they are cash expenses. Companies may also add liquid inventory to the equation. And if the firm has no revenue and stops production, COGS may be excluded from the formula.
The defensive interval ratio may also be classified as an efficiency ratio.
Conclusion
Liquidity ratio analysis is an integral part of financial analysis. Although examining organizations’ profitability and efficiency is crucial, liquidity risks remain very real and serious, as demonstrated by the 9/11, Lehman, and COVID crises.
We’ve addressed the basics of determining a company’s ability to meet its short-term obligations. If you wish to learn how to calculate these ratios in Excel, download our liquidity ratios template. Then, enroll in our Financial Ratio Analysis course to take your skills to the next level.