Resolved: How to display the endpoint of a histogram interval?
Hi,
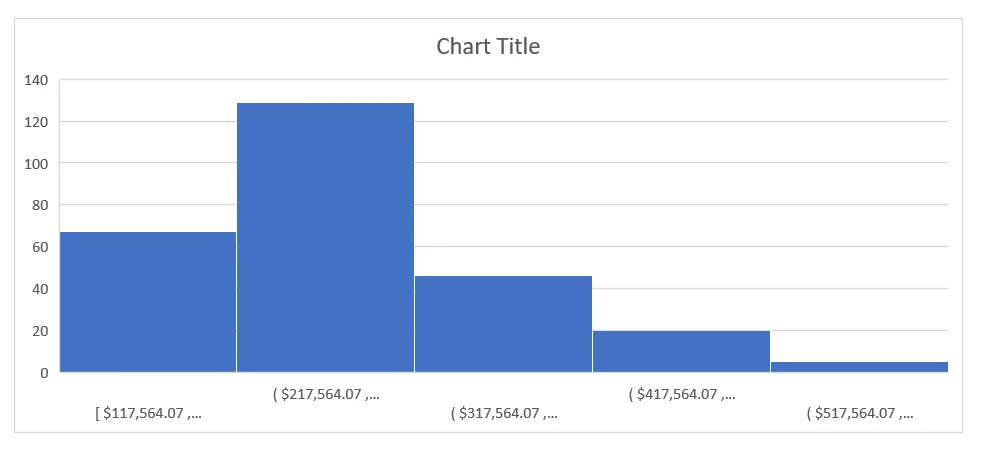
I can't figure out how to display the endpoint of a histogram interval on the X-axis. I'm using Excel 2021.
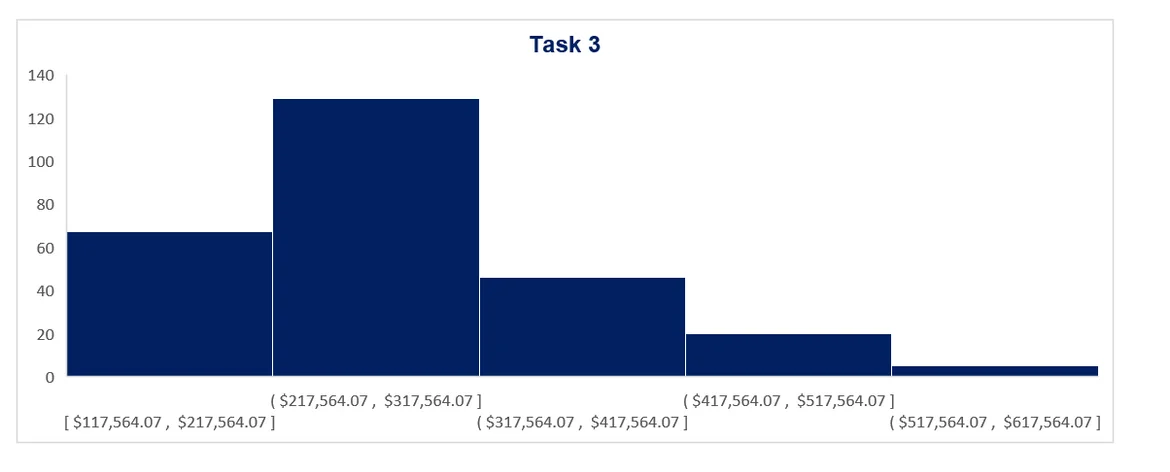
For example the exercise solution shows it but mine doesn't it. I tried going into "Format Axis" but don't know where to change.
Thank you.
Hi Quang,
thanks for reaching out! To be able to see the endpoints of the intervals you can try and:
extend the chart to the right, to allow more space for the intervals to be shown, this is probably why you're not seeing them at the moment.
Alternatively, you can:
- open the format Axis menu
-click on the Number option
-scroll down to Decimal places and change it from 2 to 0.
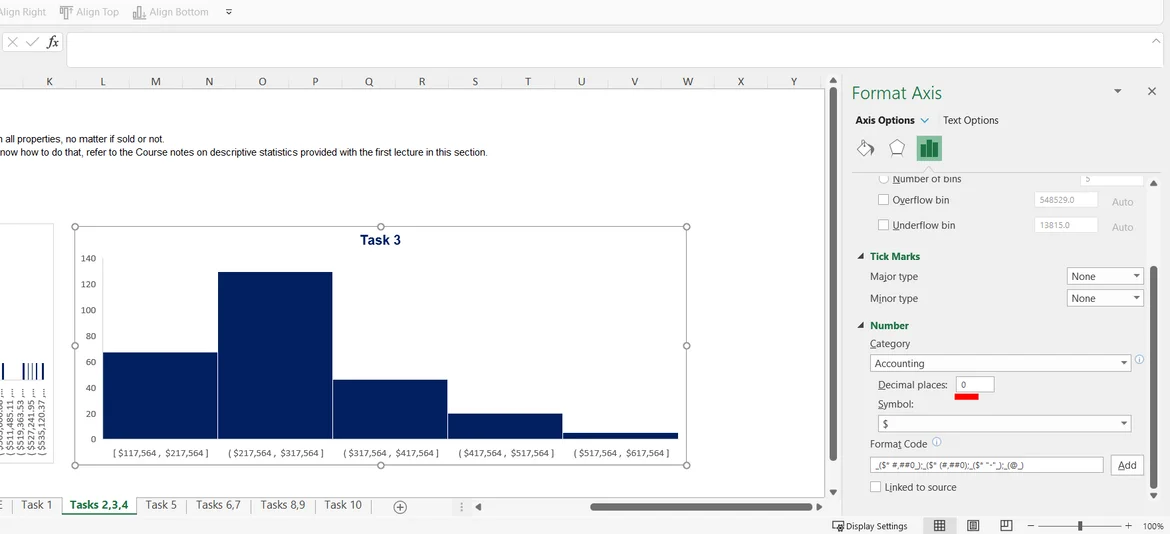
In this case, you don't really need the actual decimal places here, so the graphic actually looks cleaner and easier to interpret without the decimal points.
Hope this helps!
Best,
365 Eli
Thank you. Both of the things you mentioned worked!