How to Calculate Rate of Return in Excel
Curious how to calculate the rate of return in Excel? Master the rate of return concept, delve into the formula, and execute calculations in Excel.
Join over 2 million professionals who advanced their finance careers with 365. Learn from instructors who have worked at Morgan Stanley, HSBC, PwC, and Coca-Cola and master accounting, financial analysis, investment banking, financial modeling, and more.
Start for Free

The rate of return allows investors to assess the success or failure of an investment by quantifying the percentage gain or loss over a specific period. It provides a standardized metric for comparison across different investments or asset classes. By comparing the expected or historical rates of return, investors can make informed choices about where to allocate their capital.
This article addresses how to calculate the rate of return in Excel through an example of a stock’s average and geometric average return.
Table of Contents
- What Is Rate of Return?
- Types of Rate of Return
- How to Calculate Rate of Return in Excel
- Rate of Return in Excel: Next Steps
What Is the Rate of Return?
A rate of return (ROR) measures the performance of an investment over time. A positive rate means a gain on the investment, whereas a negative rate equals a loss. In other words, ROR is the percentage of loss or income compared to the initial amount invested.
Keep reading to learn how to calculate the rate of return in Excel with a practical example.
Types of Rates of Return
There are several rates of return that financial analysts use. This article will consider the following two types:
- Single-period Return
- Multiple-period Return
Single-period returns (or holding-period returns) are easy to calculate, and there’s only one way to obtain them. On the other hand, multiple-period returns can be determined in different ways.
Let’s look at each type of rate individually.
Single-Period Return
The single-period return [or holding period return (HPR)] calculates an investment’s total return over time, such as a day, month, quarter, or year. We aptly call that the holding period.
This rate of return includes capital gains and generated income, such as dividends or interest. It provides a straightforward measure of investment performance over a specific period. But it doesn’t consider the compounding effect or the performance over multiple periods.
We calculate the holding period return with the following formula:
HPR=\frac{Ending\ value-Beginning\ value}{Beginning\ value}As you can see, we obtain the HPR by subtracting the ending value of an investment from its beginning value, divided by the beginning value.
Let’s illustrate the formula with an example. Suppose you bought one share of Apple’s equity at the beginning of the year when it traded at $150. At the end of the year, the price increased to $190. Apart from transaction costs and dividends paid, if you were to sell your one share today, you’d receive $190; therefore, your holding period return would be 26.7%:
HPR=\frac{\$190-\$150}{\$150}=0.267=26.7\%What about cases when the asset involves additional income? We account for that by adjusting the numerator of the holding period rate of return formula as follows:
PR=\frac{Ending\ value-Beginning\ value+Income}{Beginning\ value}In other words, we aim to find the total return of an investment, not just the change between the ending and beginning value.
Let’s give an example by referring to Apple again. Imagine that before you sold the stock for $190, it paid a dividend of $10 per share at the end of the year. What is the total return?
We use the second variation of the HPR formula to find out:
HPR=\frac{\$190-\$150+\$10}{\$150}=0.333=33.3\%And so, the stock has a 33.3% return over 12 months.
Multiple-Period Returns
We divide the multiple-period returns into two types of rates:
- Arithmetic Mean Return
- Geometric Mean Return
Arithmetic Mean Return
Arithmetic mean return calculates the average return of an investment over a specified time by taking the simple average of the returns for each period.
It can be obtained by the following equation:
\bar{R_i}=\frac{R_{i1}+R_{i2}+\ldots R_{iT-1}+R_{iT}}{T}=\frac{1}{T}\sum_{t=1}^{T}R_{it}
In this formula, R is the return in a given period (t), while the capital T is the total number of periods.
Returning to our example, if Apple realizes three annual returns of 30, 25, and -20%, its mean return is 11.7%. The sum of all values is divided by the number of periods.
The arithmetic mean return provides a simple measure of average return over multiple periods but does not account for the compounding effect. It assumes that returns in each period are independent and do not affect subsequent returns.
Due to its limitations, arithmetic mean return is not commonly used to evaluating long-term investment performance or compare investments over different time frames. It is more suitable for calculating average returns over shorter periods or when the compounding effect is insignificant.
Geometric Mean Return
The second way to aggregate the holding period returns is to calculate the geometric mean return. It overcomes a critical drawback of the arithmetic average—the assumption that the amount invested at the beginning of each period is the same. This type of return considers the effect of compounding—the process in which an asset’s profits from one period can be reinvested to generate more earnings over the next. That’s very important in a portfolio context because the amount invested changes yearly as the assets realize gains or losses.
Let’s examine the formula for calculating the geometric mean return:
{\overline{R}}_{Gi}=\sqrt[T]{\prod_{t=1}^{T}{(1+R_{it)}}}-1We break down the formula as follows:
{\overline{R}}_{Gi}~represents~the~geometric~mean~return.R_i~is~the~return~in~period~t.
T~stands~for~the~total~number~of~periods.
So, how does it work? Let’s refer to the Apple stock we’ve been using as an example. The company realized three annual returns of 30, 25, and minus 20%.
By substituting the parameters, the geometric mean return is equal to 9.14%:
{\overline{R}}_G=\sqrt[3]{\left(1+0.3\right)\times(1+0.25)\times(1-0.2)}-1=9.14\%As you can see, it’s less than the arithmetic mean of 11.7%. When periodic rates of return vary from period to period, the geometric mean return will always be lower than the arithmetic mean return.
The only time the two measures are equal is when the holding period returns are the same. For example, if Apple realized 30% for each of the three years, the arithmetic and the geometric mean returns would be equal.
Other Rates and Measures
Other percentages and measures can be used to calculate the return, such as the logarithmic rate of return, internal rate of return, return on investment, return on equity, etc.
Deciding which one to use depends on the specific context. Ensure you learn as many rates as possible to pick the right one when conducting your analyses.
Now that we know what a rate of return is and what types there are let’s look at the rate of return formula in Excel.
How to Calculate Rate of Return in Excel: Example
It’s time to learn how to calculate rates of return. We’ll illustrate with a practical example.
Returning to the Apple example, we’ll start by considering buying stock from the company.
How to Calculate Rate of Return in Excel: Step 1
Your first task is to calculate the stock return over two years. How do you approach this?
Obtain the stock prices. Let’s use Yahoo Finance because it’s one of the most popular websites regarding accessible stock market data.
Type the stock ticker AAPL in the search bar:
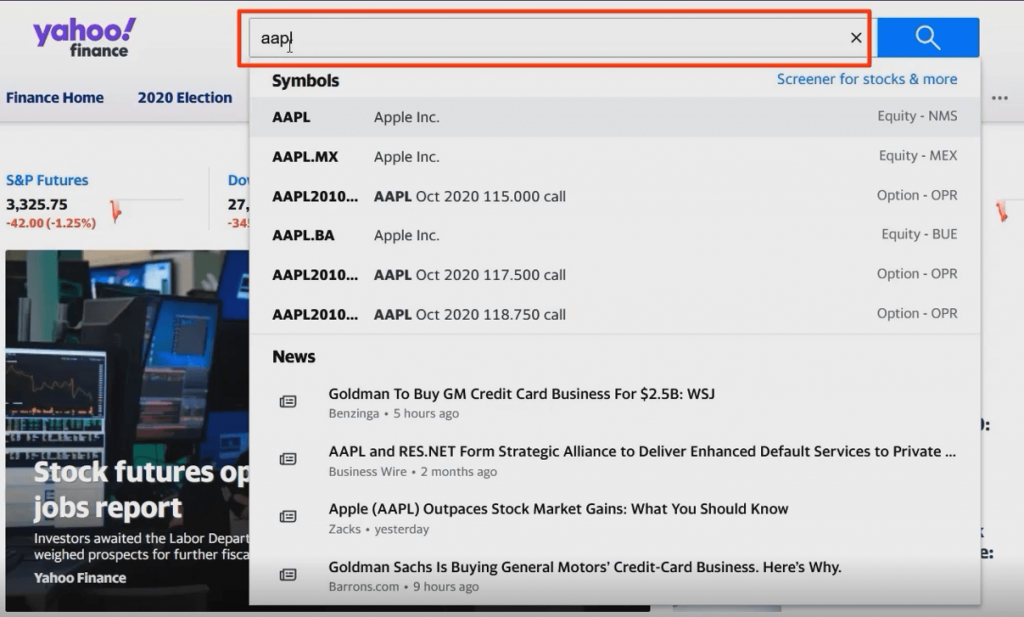
Then select historical data and download the stock prices from July 1, 2018, to July 1, 2020.
How to Calculate Rate of Return in Excel: Step 2
Now, set the data frequency with three options: daily, weekly, or monthly:
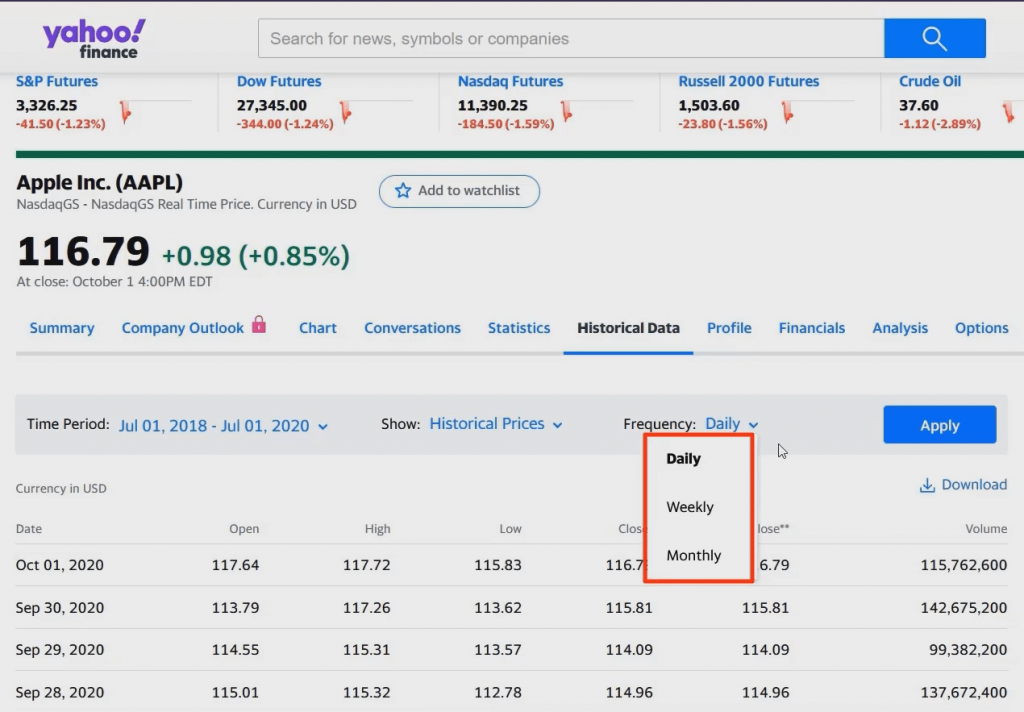
The data frequency depends on the rate of return you want to calculate. When you estimate daily returns, you choose daily frequency, whereas weekly returns require weekly frequency. And similarly, you select ‘monthly’ when calculating monthly returns.
How to Calculate Rate of Return in Excel: Step 3
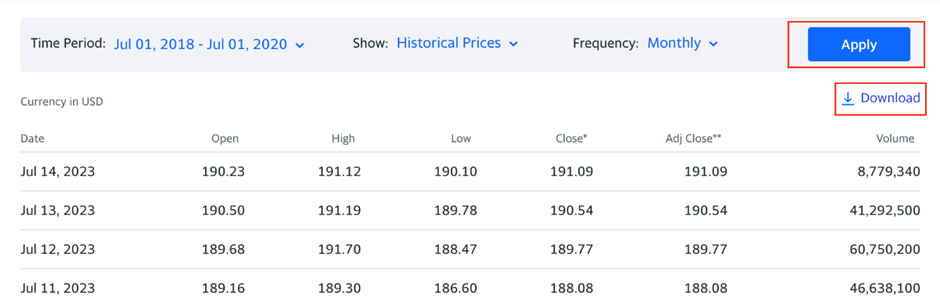
For this example, we’re interested in calculating monthly returns, which gives us 24 data points. Press Apply, then Download, to retrieve the needed numbers:
When you open the file, you see the date and rows of information about the stock price—the opening value and the highest and lowest value during the period we’ve specified:
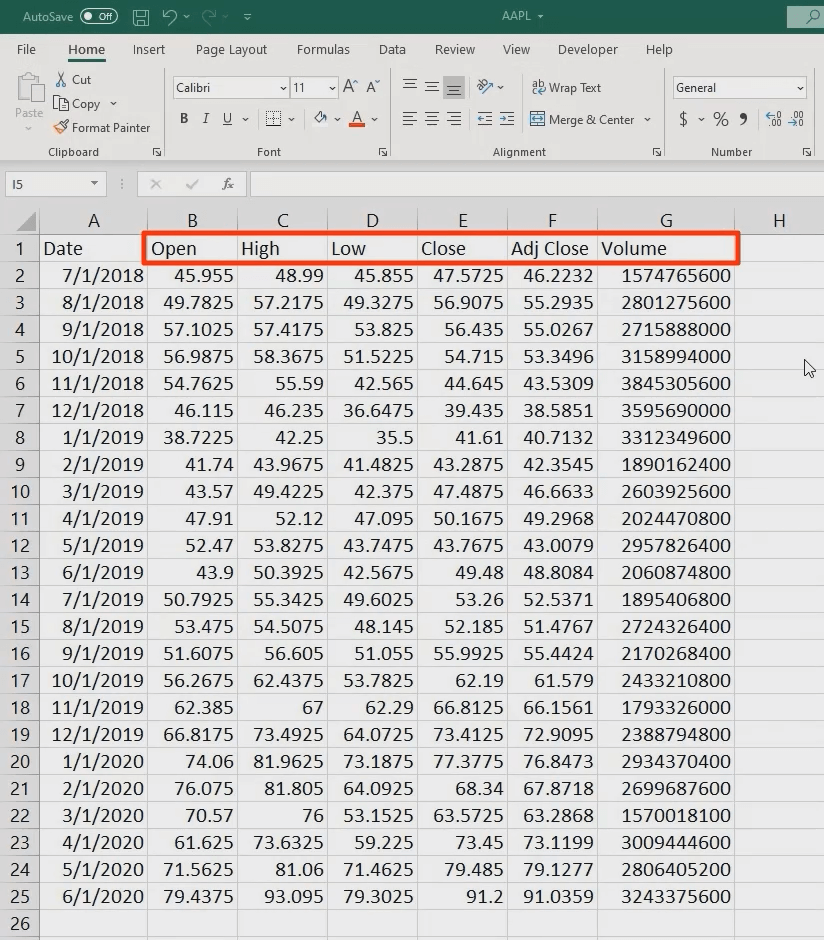
Which figures do we need to calculate the stock’s rate of return in Excel? You want either the close price (which adjusts for splits) or the adjusted close price (which adjusts for splits and dividends). Let’s opt for the latter.
We should eliminate unnecessary information and format the table more presentably based on previously provided guidelines.
How to Calculate Rate of Return in Excel: Step 4
The next task is to calculate the holding period return for the stock. Let’s refresh our memory with the proper formula to use:
HPR=\frac{Ending\ value-Beginning\ value}{Beginning\ value}In our example, we have the following:
HPR=\frac{\$55.29-\$46.22}{\$46.22}=~19.6\%And here’s what the calculation looks like in Excel:
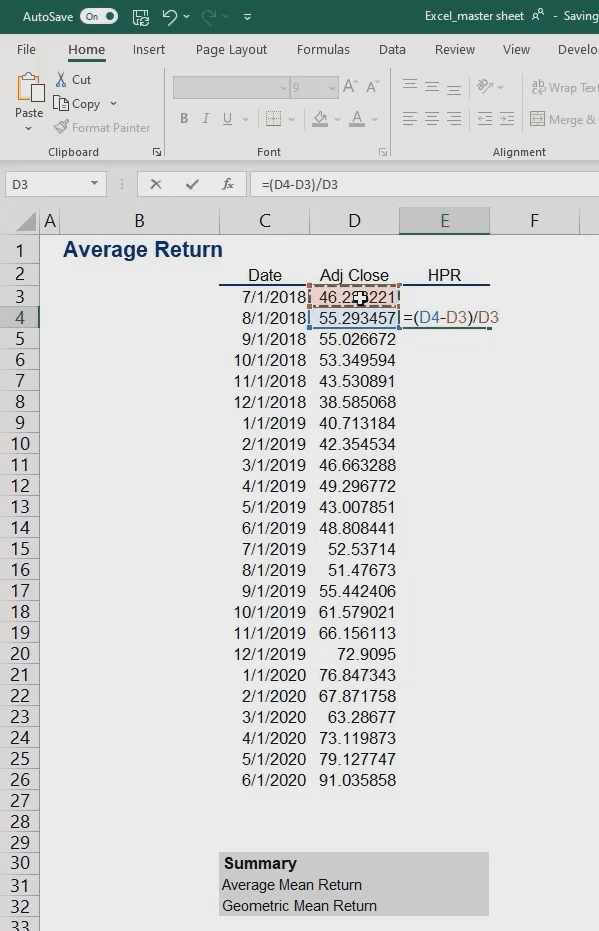
Finally, we’ll drag this formula down.
Remember to convert the values to percentages. Fortunately, there’s a fast and convenient way to do this in Excel. Select the range of values, then press and hold the Control and Shift keys and the number 5 key.
Pro tip: UsingExcel is all about shortcuts. So, be smart and use them as much as possible. This can save you a lot of time that you’ll eventually need to analyze the data.
How to Calculate Rate of Return in Excel: Step 5
The last task is to estimate the simple (average) and geometric mean returns. To obtain the former, we’ll use Excel’s average function. Select the first argument, then drag the range down to the last.
Alternatively, you can use another helpful shortcut. Press and hold the Control, Shift, and Down Arrow keys. This function marks the entire row of values below the cell you initially selected.
We now estimate the mean return to be 3.49%.
Now, let’s calculate the geometric mean return. We’ll use the geometric function, which returns the geometric mean of an array or a range of positive data. How do we use it in Excel? Type =GEOMEAN in your cell and choose the data range you’ll use.
So, remember to add 1 to the expression before closing the parentheses.
And the last step is to subtract 1 from the total:
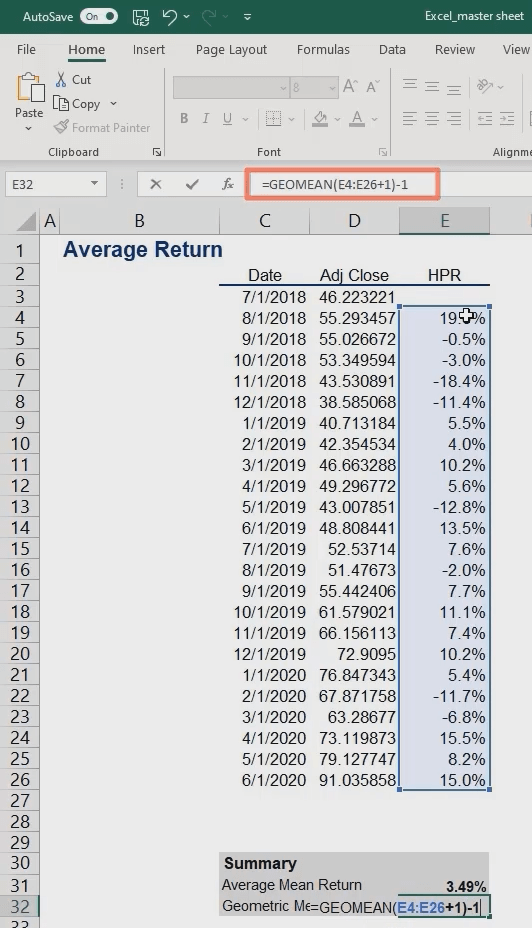
In general, Excel interprets the expression as adding 1 to each return, then takes the geometric mean.
Older Excel versions require pressing the Control, Shift and Enter keys after you key in the formula. This command makes the spreadsheet software convert the expression to an array formula—i.e., performing multiple calculations on one or more items in an array. If you’ve done that correctly, you’ll see brackets within the cell automatically. The result we obtained for the geometric mean comes to 2.99%.
And that’s how to calculate the rate of return in Excel.
How to Calculate Rate of Return in Excel: Next Steps
Knowing how to calculate rates of return allows finance professionals to make informed decisions on asset allocation, portfolio management, and investment strategies. Developing this skill in an accessible yet in-demand software like Excel opens the door to a deeper understanding of investing that will help advance your skills. Learn how to select and manage investments with our Portfolio Management course.
Sign up for the 365 Financial Analyst platform and advance your finance career. If you already have an account, log in and pick up where you left off.