How to Download Historical Price Data In Excel Using Yahoo Finance
Join over 2 million professionals who advanced their finance careers with 365. Learn from instructors who have worked at Morgan Stanley, HSBC, PwC, and Coca-Cola and master accounting, financial analysis, investment banking, financial modeling, and more.
Start for Free

One of the first things an investor needs to do is start gathering financial information.
In this article, we will learn how to obtain analysis-ready historical stock prices.
There is a large number of data providers we can rely on, but the easiest way is to use Yahoo Finance. It allows you to download historical stock prices in Excel which is exactly what we need here.
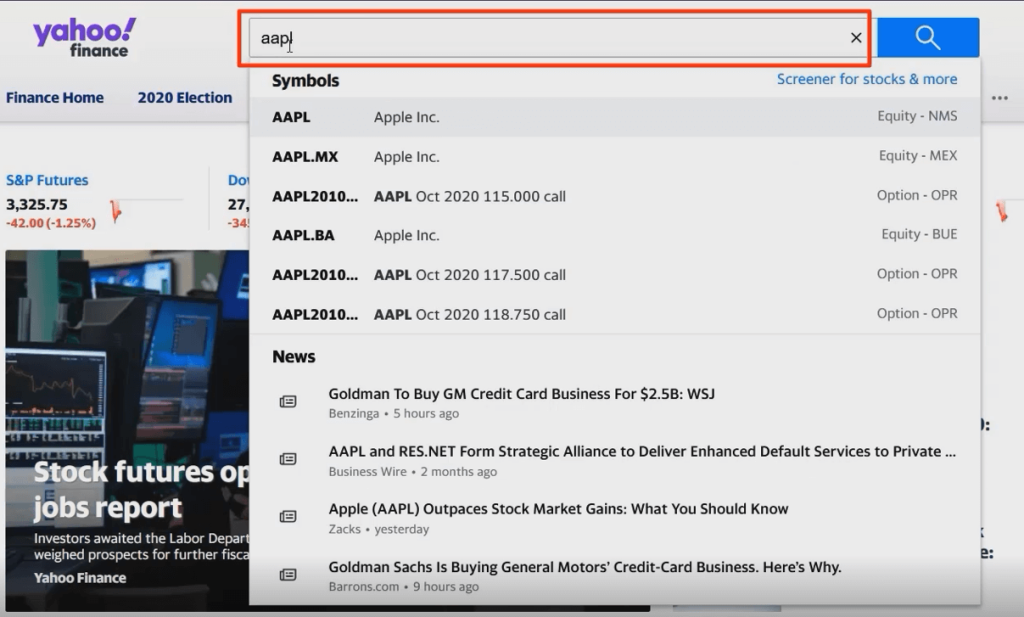
Suppose we want to obtain Apple’s stock price for the last 2 years.
We type in the ticker symbol “AAPL” and hit enter to get into the summary page.
Here, we see plenty of tabs. Most of them are free to access. For example, the statistics tab gives you a quick overview of the most important company ratios such as the price-to-earnings and price-to-book multiples.
Some of the functionalities, however, are locked for those of you who subscribe for premium access.
But that’s alright! We can easily recreate most of the data by using available public information.
Let’s not get ahead of ourselves! That’s a topic for our next articles.
For now, we will focus on the firm’s historical stock prices.
To acquire them, you need to select the historical data tab. Then we need to mark the time period. In our case, this would be from July 1st, 2018 to July 1st, 2020. Click ‘done’ and pick the desired data frequency.
There are 3 options to choose from – daily, weekly, or monthly.
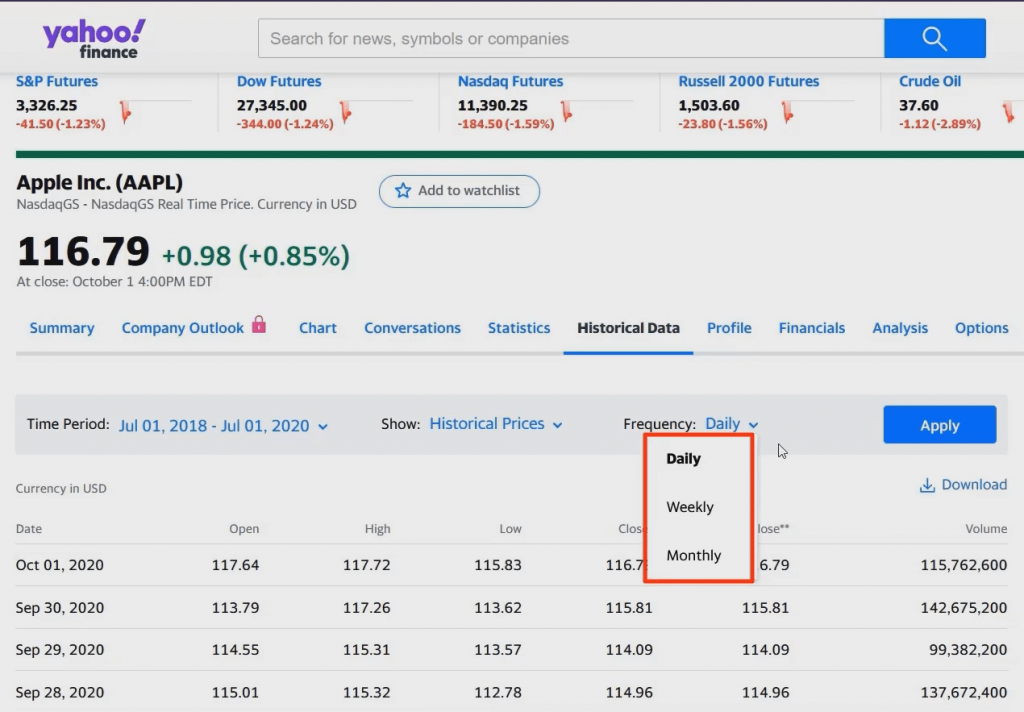
Basically, the choice of data frequency depends on the return you will calculate.
So, when you estimate daily returns, you go for daily frequency. Weekly returns require weekly frequency. And so on.
Let’s say we will calculate daily returns.
We hit apply and voila!
You have got the data sorted from the latest to the earliest date.
Next, we need to store the data to analyze it.
Just press download and save it accordingly.
Time to check out what we’ve got…
We open the file and come across the date and a whole bunch of information about the stock price, such as the opening, along with the highest and lowest value during the period you specify.
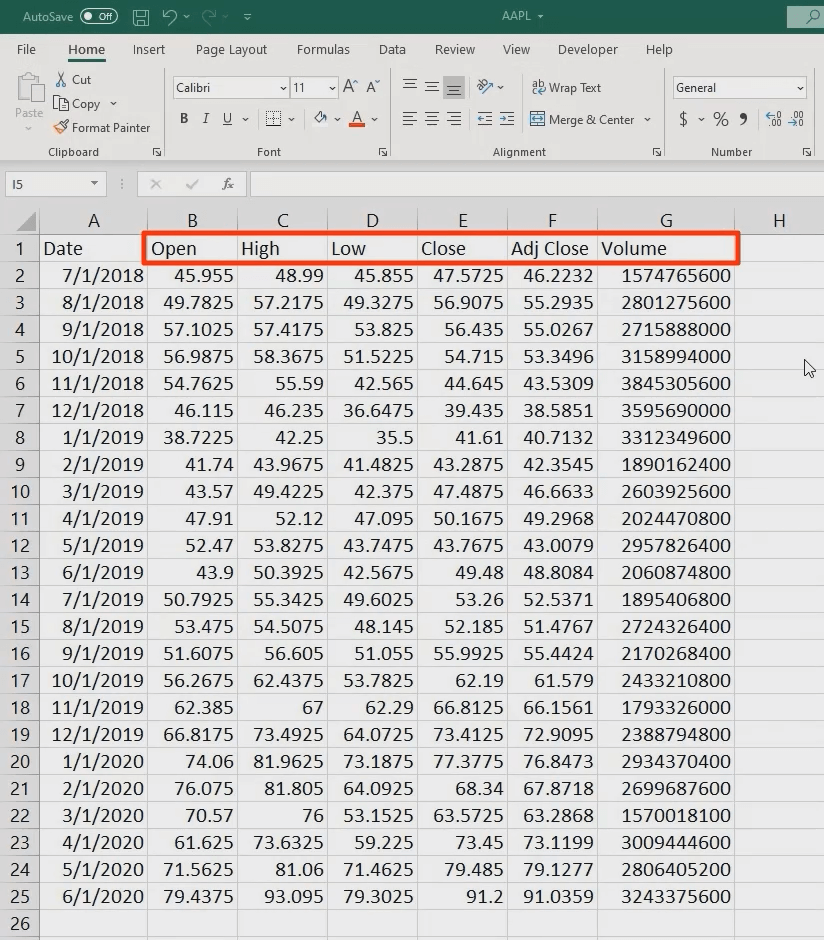
Which are the figures our calculations require, though?
Well, we do need the close or the adjusted close price. The former adjusts for splits, whereas the adjusted one for both dividends and splits.
Hence, we will use the adjusted close price. For conciseness, we get rid of all the information we won’t utilize.
Here is one important advice!
When you start working with financial data in Excel, always use the best-possible formatting. This is what we’ll dive into in our next articles.