NPV vs. IRR
Join over 2 million professionals who advanced their finance careers with 365. Learn from instructors who have worked at Morgan Stanley, HSBC, PwC, and Coca-Cola and master accounting, financial analysis, investment banking, financial modeling, and more.
Start for Free

When it comes to capital budgeting, there are various approaches to evaluating a single investment or ranking mutually exclusive ventures. According to a survey conducted by Graham and Harvey (2001), Net Present Value (NPV) and Internal Rate of Return (IRR) are among the most common techniques used in practice.
What are NPV and IRR?
NPV is the present value of future inflows, net of present value of future outflows. The formula to calculate the NPV is as follows:
NPV=-Outlay +\sum_{t=0}^N \frac{CF_{t}}{(1+r)^t}The term CF_{t} is the expected net cash flow at time t, N is the projected life of the investment, and r is the discount rate (also known as the opportunity cost of capital). According to NPV, a single project is considered acceptable if its NPV is positive.
IRR, on the other hand, is the discount rate which, when used to calculate NPV, would make the Net Present Value equal to 0. We use the following expression to calculate the IRR:
0=NPV=-Outlay + \sum_{t=0}^N \frac{CF_{t}}{(1+IRR)^t}We accept a project if its IRR exceeds its discount rate (IRR>r).
NPV vs. IRR: Comparison
As one might easily notice, the two concepts and formulas lie on common ground. In fact, they are Yes/No tools to accept or reject а single project. And since the time value of money concept is applied in both instances, we consider these measures economically sound. In the world of Corporate Finance, NPV and IRR are widely used among analysts and CFOs. Typically, higher NPV and IRR values are indicative of more beneficial projects.
However, there are a few differences between IRR and NPV that are also worth mentioning. To begin with, it is not appropriate to rank projects using IRR — reinvesting at the same rate as IRR is unrealistic. Though, reinvesting at the same rate as the opportunity cost of capital implied by the NPV calculations is economically realistic. Hence, ranking projects based on their Net Present Value is deemed reasonable.
Moreover, IRR does not allow us to use different discount rates throughout a project’s life, as it implies a single rate of return. However, when using NPV, an analyst might easily apply various discount rates to the calculations. What’s more, the NPV result is expressed in monetary value, whereas the IRR calculation provides us with a percentage or rate.
We’ve summarized the most important characteristics of both techniques in the table below:
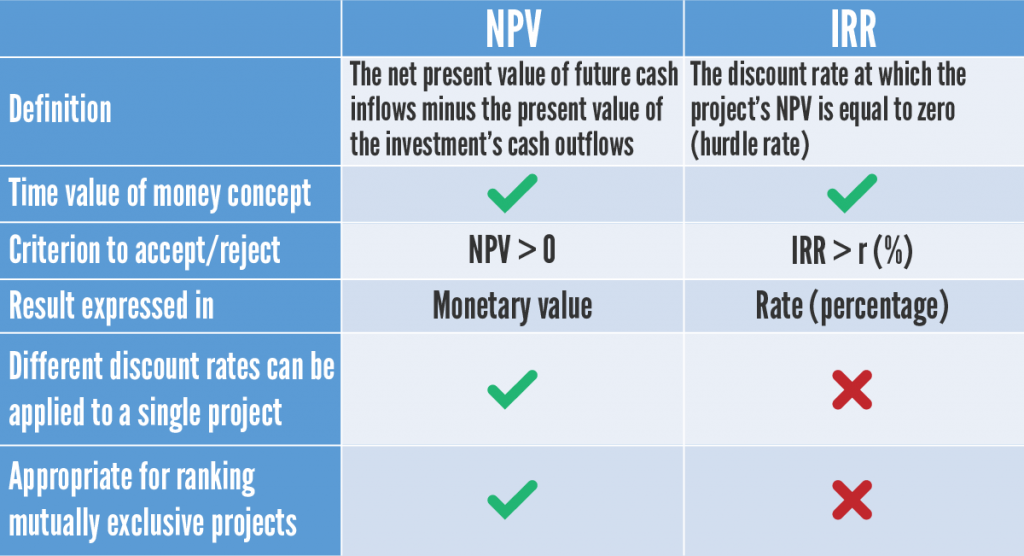
Should NPV and IRR Be Used in Capital Rationing?
Drawing a conclusion about a project when NPV and IRR results do not agree with each other may seem like a challenging task. That’s why it is important to determine what answers you seek to find.
When NPV and IRR are used to evaluate a single project on a stand-alone basis, they will mostly provide identical recommendations. So, we can easily incorporate either of the two.
However, to select a single project (a process also known as capital rationing), companies with a limited budget should opt for NPV. The Net Present Value represents the discounted added monetary value a firm gains from a venture, given its net cash flows and opportunity cost of capital. Hence, it is a better indicator of added shareholder wealth, as compared to IRR.
By contrast, IRR is merely the hurdle rate above which the project can be accepted. In reality, a particular investment might have a high IRR but a small net cash inflow. Thus, it seems irrational for organizations to rank ventures using the Internal Rate of Return instead of NPV.
NPV vs IRR: Example
Suppose that you have been given the task to consider three potential investments that are mutually exclusive. Each requires an initial outlay of $300 million, and the company can undertake only one of them.
The opportunity cost of capital is 5% at the company level. The first project’s risk is considered the same as the company’s risk, thus you assign a 5% discount rate. Project II has an 8% discount rate because of an additional 3% risk premium. Upon reflecting on the specific risk factors of Project III, you end up adding 7% on top of the opportunity cost of capital, which arrives at a discount rate of 12%. Forecast cash flows are shown below:
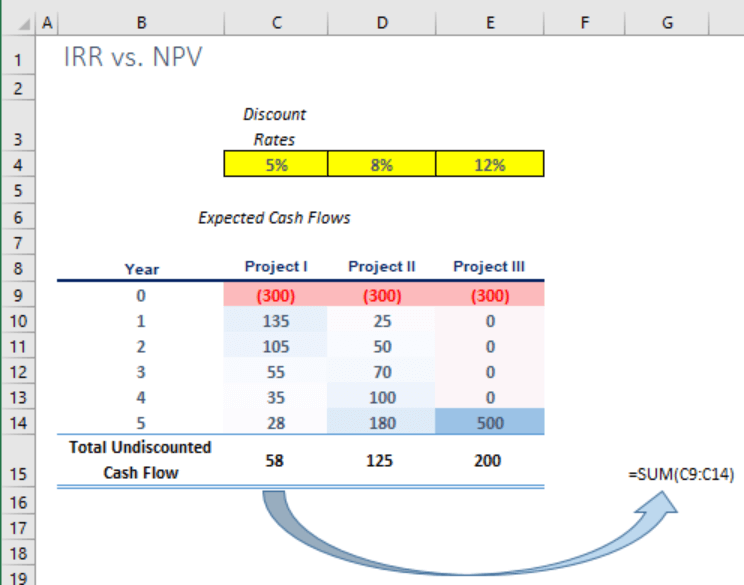
If you look at the undiscounted cash flows to rank the project (see above), you will likely determine that, at first glance, the third project seems to be the most lucrative investment.
It is only after examining the results of both IRR and NPV that you gained a realistic view of the projects’ potential:
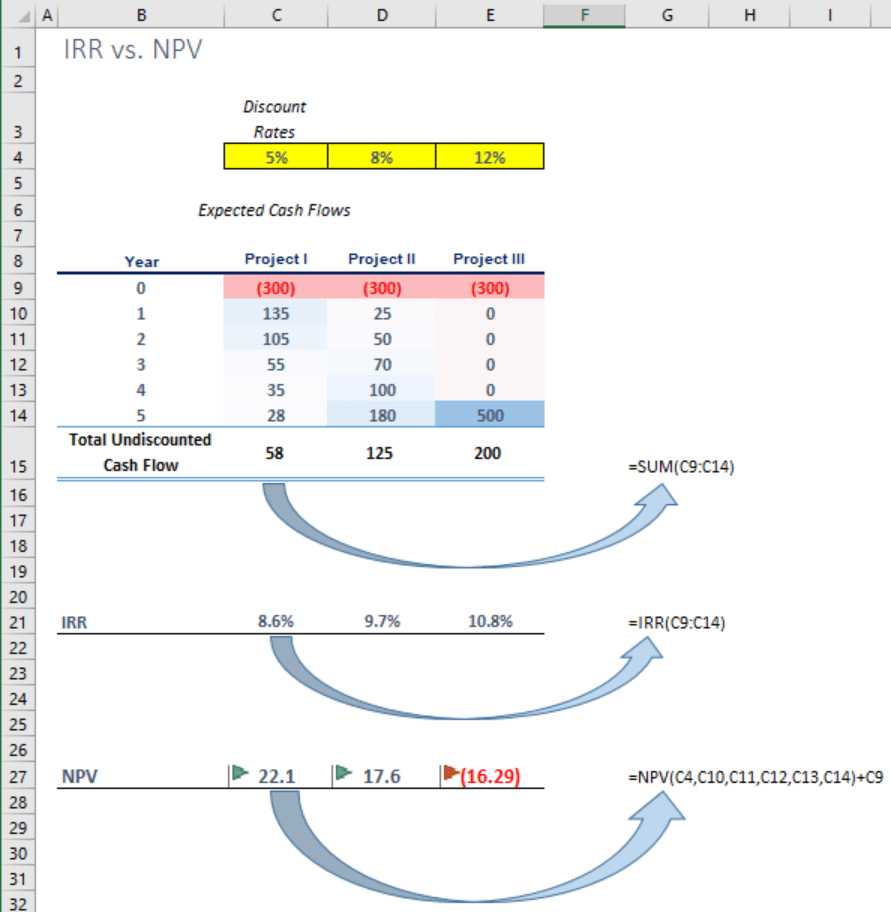
You are quick to notice that the third project has the highest internal rate of return. But is it the most attractive and acceptable investment according to the NPV?
No, it isn’t. The truth is that Project III returns a negative Net Present Value. Besides, the IRR figure is lower than its discount rate. Considering the fact that it pays off in the final year only, we now know why a higher discount rate was applied to it in the first place. All in all, the third project adds a negative value to the business and should be rejected.
The second alternative returns a positive NPV and can be accepted on a stand-alone basis. Still, our budget is limited, so we should dig deeper to rank the remaining two opportunities and find out which alternative gives the highest NPV.
After careful consideration, the company accepts Project I and rejects Project II and Project III.

For projects that are not mutually exclusive, IRR and NPV would provide the same conclusions upon evaluating each venture separately. We summarize these recommendations, given the rules:
- accept if IRR > r (and reject if IRR<r)
- accept if NPV > 0 (and reject if it is below 0)
Summary
When NPV and IRR conflict with each other, the NPV analysis is the appropriate indicator to rank different projects. Generally speaking, we might say that NPV provides more flexibility to the analyst using either technique. To define the barrier for the discount rate, however, one still turns to the IRR measure. That’s why a financial analyst should be familiar with both approaches, as they provide different perspectives on an investment decision.
To learn more about capital budgeting techniques, check out the other available resources we’ve prepared for you in our Corporate Finance section.