Industry Capacity and Market Share Stability
Join over 2 million professionals who advanced their finance careers with 365. Learn from instructors who have worked at Morgan Stanley, HSBC, PwC, and Coca-Cola and master accounting, financial analysis, investment banking, financial modeling, and more.
Start for Free

Apart from barriers to entry and industry concentration, analysts also consider industry capacity as well as market share stability for determining the pricing power and competition.
Understanding Industry Capacity
Industry capacity represents the maximum amount of goods or services that companies can supply in a period. When there is undercapacity and demand exceeds supply, market players have high pricing power. The product price increases and so does the return on capital. In the case of greater supply and reduced demand, however, firms compete for a limited number of buyers and often engage in price wars. This, of course, results in a lower return on capital.
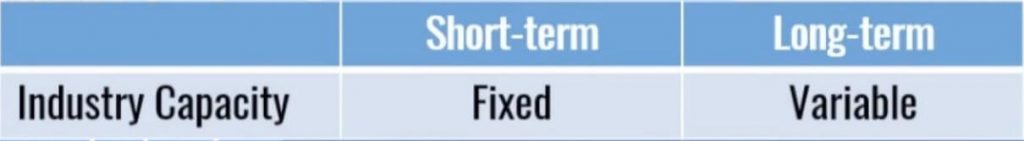
In the process of performing an industry analysis, we should always consider its current and future capacity. From a more general perspective, capacity is fixed in the short run and rather variable in the long run:
Suppose that there is a sudden surge in demand for airplanes. Obviously, companies such as Boing would not be able to meet the increased number of orders immediately. After all, it takes years to build new factories. However, given sufficient time, the management would be able to adjust to the new market conditions and open additional production plants. In that regard, the key question for our analysis is – “What does sufficient time mean?”
For some industries, such as semiconductors, it takes years. Opening a new plant is not an easy process. It requires a lot of preparation, regulatory permits, and personnel. In other situations, adjusting to the new market environment takes considerably less time and effort. The service industry is a good case in point. There, all you need is more financial and human capital. This makes these companies more adaptable to changing market conditions. Should there be overcapacity, they can reallocate funds to more productive use. If there is a strong demand, insurance companies such as AIG don’t have to build physical factories.
Industry Capacity for Cyclical Firms
For the most part, how long you need to accommodate increased demand is important especially in cyclical markets where earnings are highly dependent on the strength of the overall economy. Put in plain language, these companies’ profits expand or contract in line with the economy.
So, why timing is so crucial for cyclical industries?
Consider the shipping industry that was hit by the economic crisis of 2008. Driven by the rapid China industrialization and global economic growth, the demand for cargo ships was very strong in the early 2000s. In fact, transportation rates were as high as $160,000 per day. Riding the wave of the industrial upswing, shipping companies hurried up and invested heavily in new cargo vessels.
However, building new shipyards was a long process. By the time they were up and running, the year was 2008 and there was already a decline in global demand for commodities. So, they missed it! This was the result of the highly capital-intensive nature of the industry, coupled with its inherent cyclicality. In reality, specialized production equipment is quite difficult to re-deploy and adapt to the changing environment quickly. After all, you can hardly use cargo ships for anything else.
Regardless of the nature of business, when we evaluate an entity, we should examine the current and future production capacity of its competitors. This gives us valuable insights as to whether the output will be more than the industry demand, and vice versa.
Understanding Market Share Stability
Along with industry capacity, we can consider the so-called market share stability. Our main task here is to analyze how stable the market shares of the field players are. Highly variable market shares indicate that the industry is competitive, and the pricing power is limited. By contrast, a stable share implies less intense competition.
Generally, three factors affect market share stability. These are the barriers to entry, frequency of new product introductions, and the switching costs:
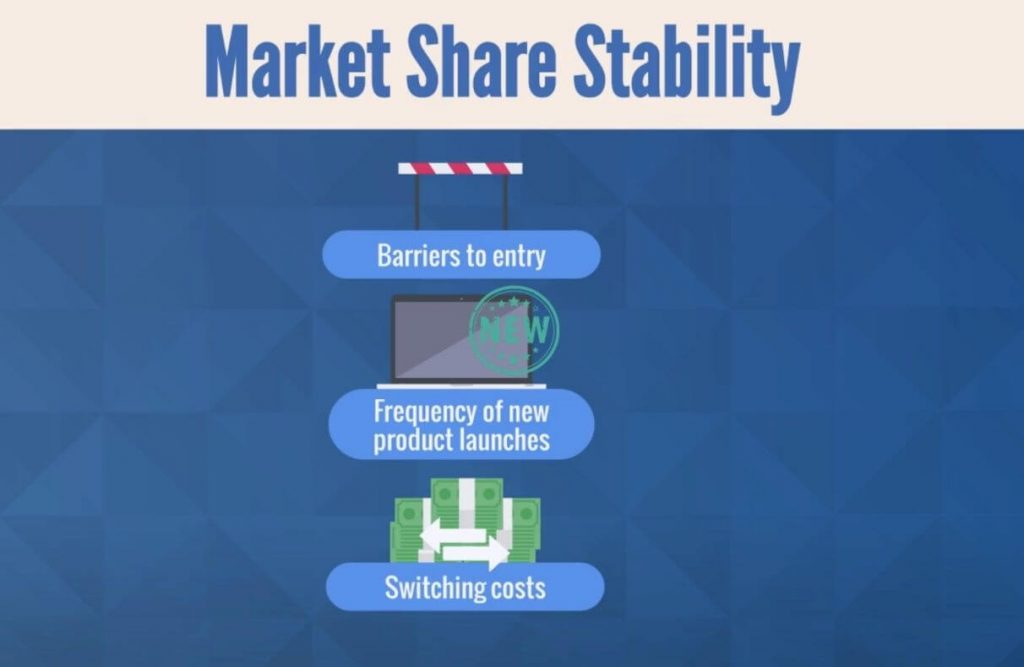
When barriers to entry and switching costs are high while new product introductions are low, then we have high market share stability.
Let’s take a look at Microsoft. Suppose you are an entrepreneur who is eager to succeed in the technology sector. You may develop a new operating system that can compete with Windows, but that’s not all. You should then convince people to use it and design thousands of applications that can run on it. Besides, you need to think about the switching costs involved. What’s more, your clients will have to invest time and money in getting to know and accessing the system.
At the end of the day, most Microsoft customers will ask you one fundamental question, “Is it worth the extra effort?” The answer is probably “no”.
This is what one of Microsoft’s former general managers writes to Bill Gates back in 1997:
“It is this switching cost that has given our customers the patience to stick with Windows through all our mistakes, our buggy drivers, and many other difficulties.”
On the contrary, unstable shares are inherent for companies with low switching costs and entry barriers, but a high number of new product introductions. Tesla is a good illustration of that. It operates in a quickly developing industry with lots of innovations.
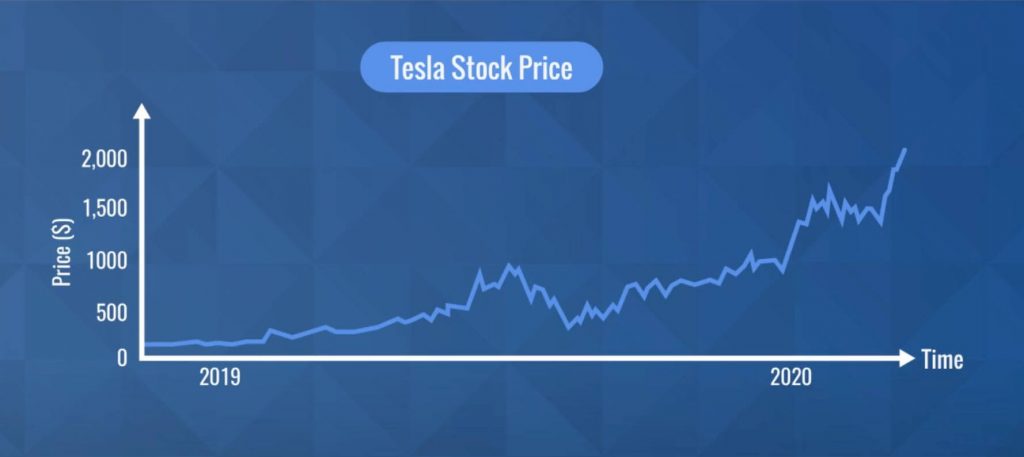
As you can see on the graph, its stock is quite volatile. The company faces strong competition against established brands like BMW, Toyota, and Daimler. At the same time, the low impediments for customers to buy cars from other manufacturers further strengthen the force of competition. Logically, all of these factors lead to low market share stability for Tesla.
The Bottom Line
It is important to evaluate the factors that have an impact on pricing and competition in an industry. But companies change over time, and so do industries. That’s why the dynamics of the business environment require you to add a more thorough approach to the analysis.
That’s how the Industry Life Cycle Model came into existence. Nowadays, it is a common tool for analysts to understand the growth and development of an industry.