The Business Cycle
Join over 2 million professionals who advanced their finance careers with 365. Learn from instructors who have worked at Morgan Stanley, HSBC, PwC, and Coca-Cola and master accounting, financial analysis, investment banking, financial modeling, and more.
Start for Free
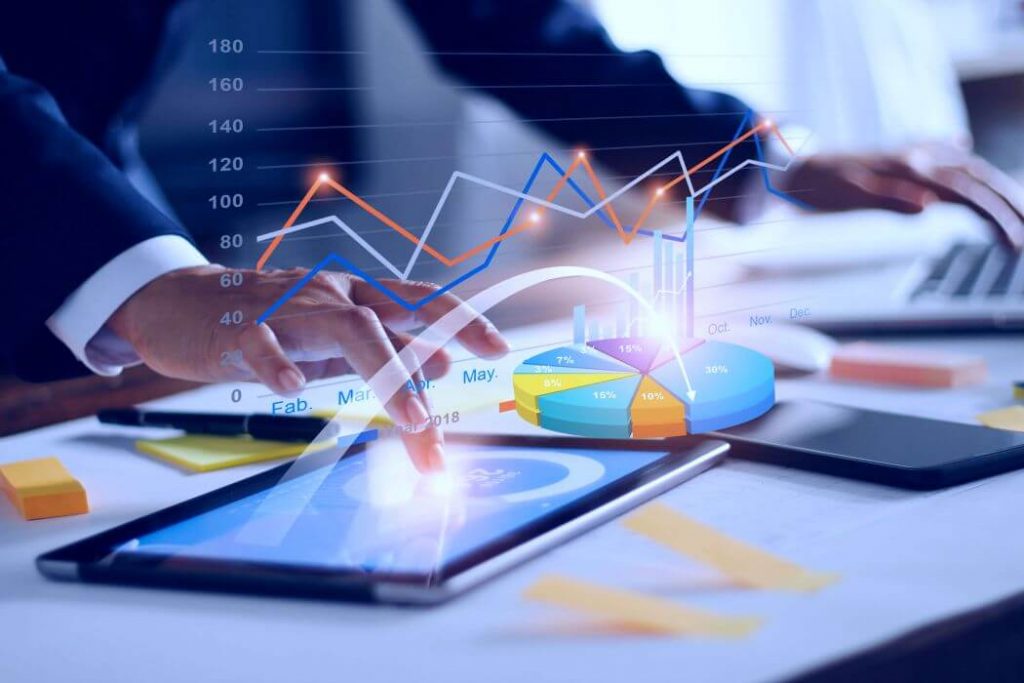
There are different theories on how to keep an economy stable and growing. Understanding the business cycle is a big part of the solution.
The Evolution of Busines Cycles
Back in the days, production cycles in agricultural societies were very unpredictable. Whether a harvest was going to be successful or not depended on weather conditions. Moreover, plant and animal diseases had a considerable negative impact on the harvest.
Nowadays, things have changed – societies have become industrial in nature and economic activity tends to be more diversified. Still, we experience short-term and long-term economic movements for various reasons. Population growth, for example, is a crucial factor shaping up an economy’s growth potential.
The graph below shows how a typical economy fluctuates with time:
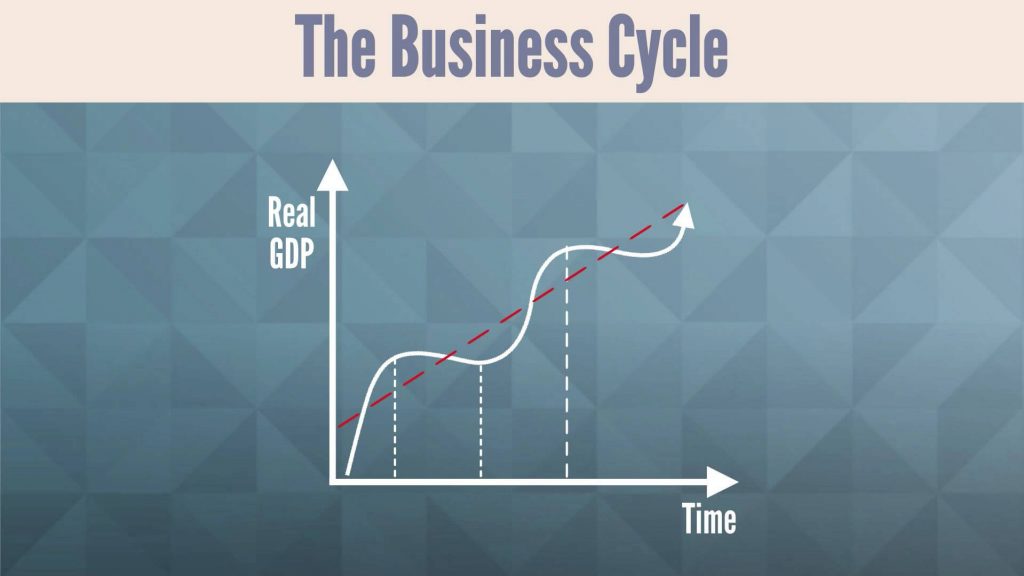
On the vertical axis, we have the real output of goods and services (Real GDP), and the horizontal axis represents the evolution of time. The red line shows average GDP, or the trend line of economic growth, over a selected period of time. So, the business cycle is characterized by fluctuations in economic activity or the real gross domestic product (GDP) of a country.
Of course, business cycle phases vary in terms of amplitude and duration. On the graph, it might look like they are similar in size and happen at relatively regular intervals. However, different stages can last from a quarter up to a decade and even longer. For example, the downturn related to the dot-com bubble in the year 2000 lasted 3 years, while the 2008 financial crisis stretched for almost 6 years. Thus, predicting the phase in which an economy would be a few years from now could be a real challenge.
Business Cycle Phases
In exploring the business cycle phases, we will discuss changes in total GDP growth, level of unemployment, consumer and business spending, and inflation. Here’s a plot line of a typical business cycle path:
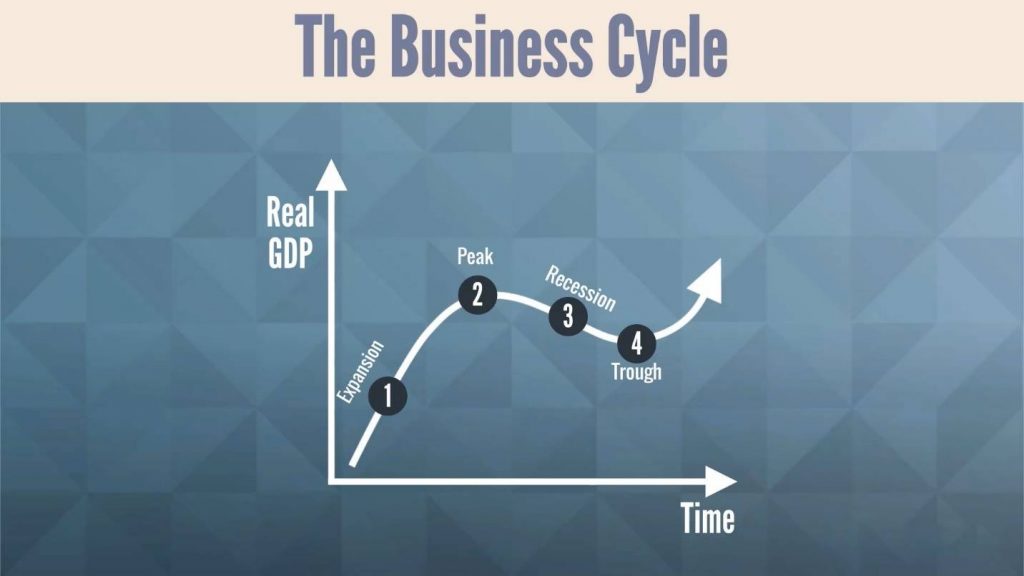
- Expansion: A cycle usually starts with an expansionperiod. In this phase, GDP grows very fast and there is an increase in employment, consumer spending, and business investments. Sales proliferate while the inflation rate picks up modestly.
- Peak: Eventually, economic growth slows down and the expansion phase reaches its peak. This is the point where GDP is at its highest. Here, the total output is maximized and starts decreasing. The unemployment rate is still low and, in some cases, continues to decrease. Consumer and business spending is at its peak, too. So, the inflation rate goes up and accelerates further.
- Recession (Contraction): After the peak, a recession period follows. Total economic activity declines, which means negative growth rates. Investments, consumption, and inflation decline, too. Consumer spending and business investments in terms of industrial production go down as well. There is also a downturn in sales of goods and services. As a result, the unemployment rate increases because businesses need to cut working hours, stop hiring, and start employee lay off rounds. When the recession is severe and lasts for three or more years, it turns into depression. A notable example is the Great Depression in the 1930s, which caused the worldwide GDP to fall by 15 percent!
- Trough: A recession always reaches a trough – the lowest point in the business cycle. Toward the end of this stage, the GDP growth rate starts changing from negative to positive. The trough is followed by a phase of recovery (early expansion). This is considered the start of another business cycle. Some believe that “recovery” is a stage on its own. Actually, the phase of recovery sets the beginning of a new series of events, so we may see it as the cutting line, though blurry, between business cycles.
In short, the big picture looks like this: the overall economic activity, employment levels, consumer and business spending are the highest during the peak, while unemployment and inflation usually reflect the cyclical changes with some time lag. Thus, inflation is low during the recovery stage, increases during the peak, and starts going down after the contraction has already started.
The Business Cycle at a Glance
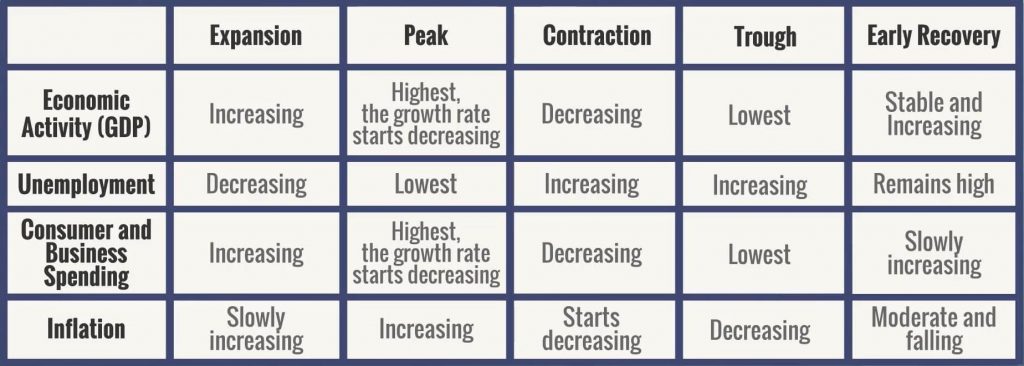
Below, you can find a summary table representing the four Business Cycle phases and their features:
Typically, stock prices drop during contraction periods. That’s why investors should monitor the movements of an economy and its indicators closely. In reality, three factors trigger each business stage – the power of supply and demand, the availability of capital, and consumer confidence.
For analysts, however, it is equally important to analyze a few companies and not the whole economy. This effectively gives them an idea about the direction of an industry and the movement of a business cycle, on a different level. To conduct such an analysis, comparable companies can be placed together in a peer group. This, however, requires certain criteria to be met.
Take a look at the principles of constructing a peer group now!