Resolved: What if we have a distribution with 2 peaks ?
Hi
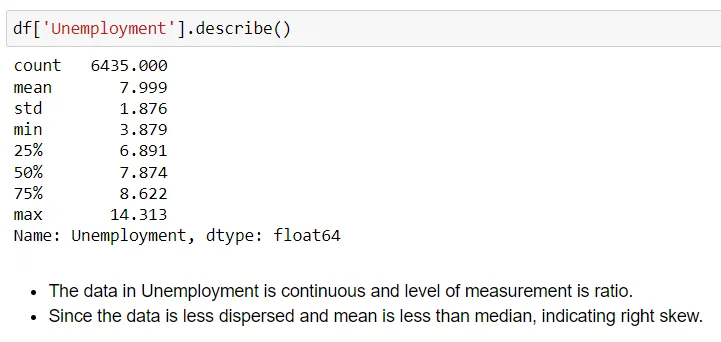
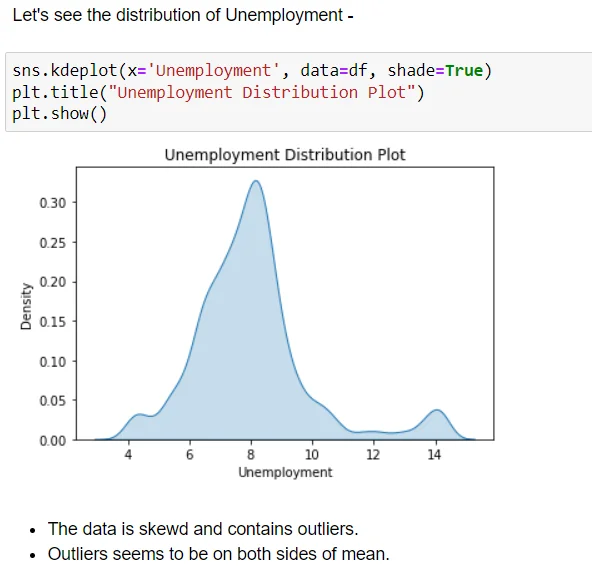
I came across data with an 'Unemployment Ratio' where distribution is very interesting.
The mean of the dataset is greater than the median indicating right skew.
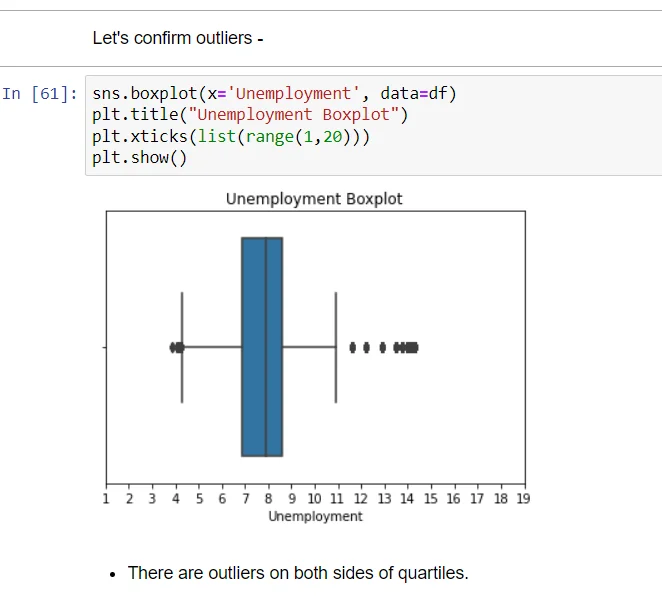
But when I see the boxplot of distribution, the outliers are on both sides.
Is skewness misleading or what?
How to proceed with this type of data ?


1 answers ( 1 marked as helpful)
Hello Swarntam,
Thanks for reaching out!
No, I don't think the right skew is misleading. It is true that in most cases when the data is skewed to the right, you can expect outliers to the right. But that's not 100% accurate. Let's say it's more like the typical case. But you should be always aware that there is a chance that the outliers are also present on the left tail.
Best,
The 365 Team