Problems with the third chart
Hello,
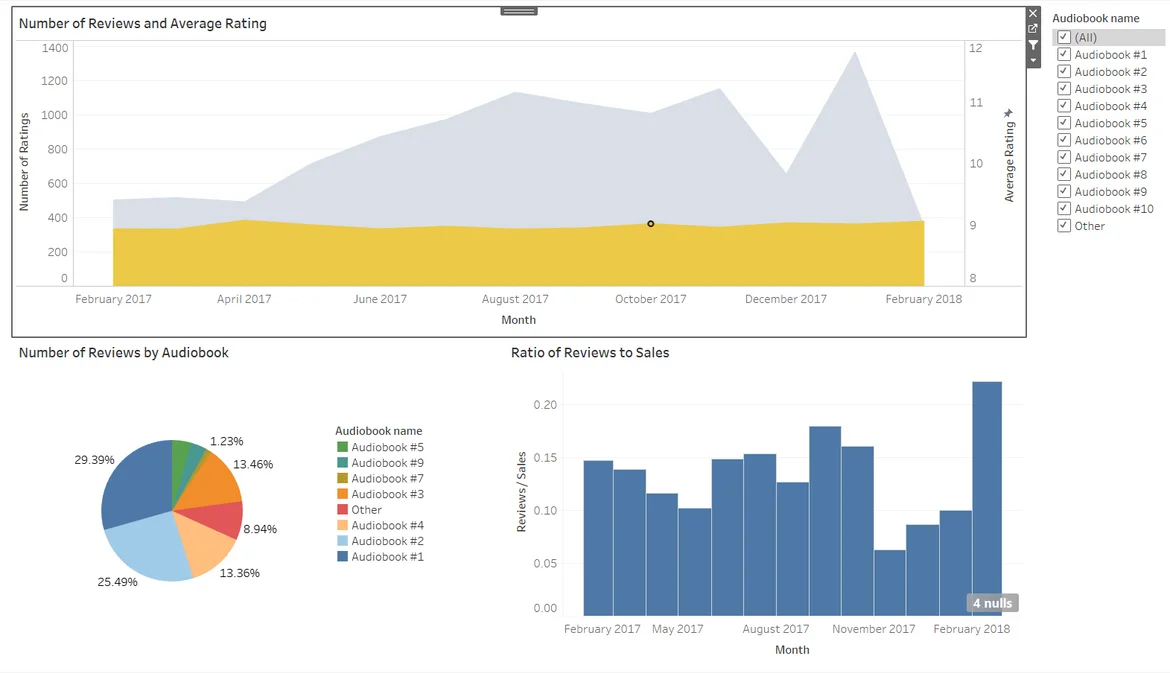
I watched the creation of charts and dashboards multiple time, as well as the fix for interactive filters. However, my chart looks very different to the one in the video and I can never get the third chart to filter by month. In the screenshot below, I selected the month of October 2017 in Chart 1 (Area), then Chart 2 (Pie) changed in order to show the distribution of reviews for the audiobooks in the same month, but nothing happens to Chart 3 (Bar).
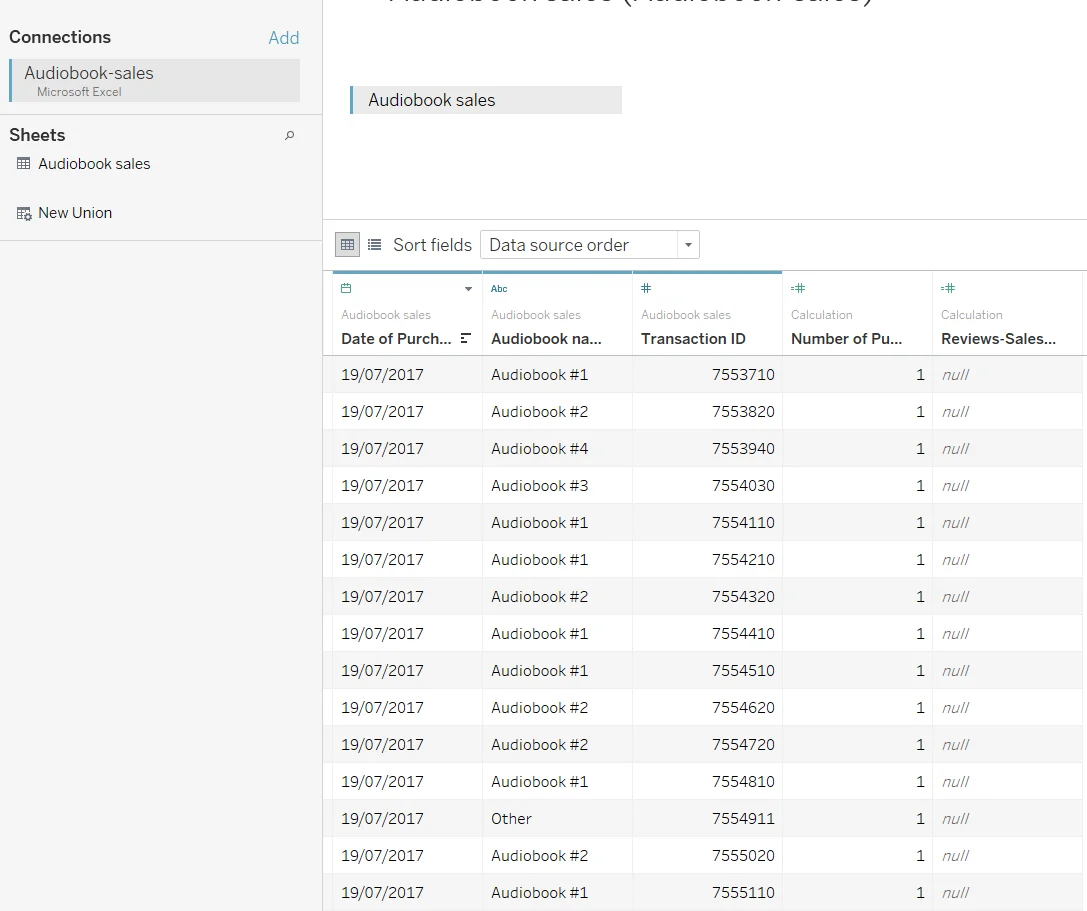
I also want to cite the question entitled "I am getting miscalculations for the review / sales calculation in 'third chart' Tableau" as I had the same case as John, where the records of the calculated field Reviews/Sales are all Null.
Hello,
Good to hear from you and great to see that you are making progress.
In this case, it would be difficult for me to solve the issue from a distance because it looks like you have solved the task. What I would recommend is for you to start the task again and try to do exactly as shown in the video. My guess is that the connections that were created were broken at some point. If you repeat the exercise, you will be able to find what didn't work the first time.
Best,
Ned
Hi Ned,
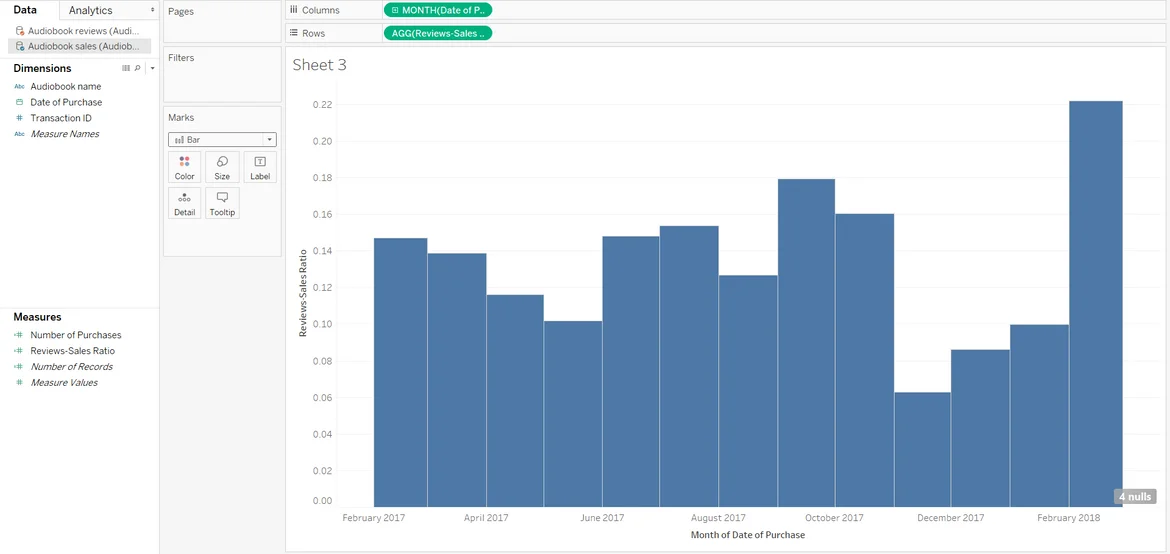
Maybe we can focus on the third chart first. I repeated the exercise from scratch, and chart 3 is where I encountered problems. In timestamp 1:57, you inserted the Reviews/Sales calculated field in the Rows to create a Bar chart. If we compare the chart below and the one from the timestamp, the difference in trend is apparent. Then, if we look at the data source to check the calculated field Reviews/Sales, all records are Null. Why is that?