Resolved: Different result with Excel formula
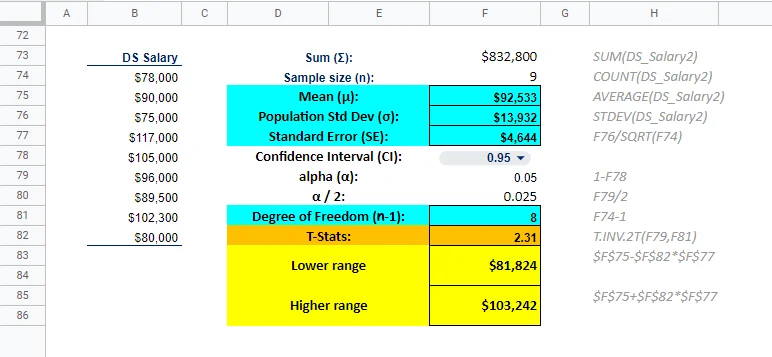
I did calculation in Excel with T.INV.2T, function T score number is the same (2.31) but the final result is slightly different (81824-103242 instead of 81806-103261). I notice it might be because the formula actually returned 2.306004135204 but the table is rounded to 2 digits 2.31.
My question is does it matter? But math supposed to be precise isn't it? Or I might use the wrong formula, what is the better way to do it because I don't really like looking-at-the-table-manually method since it is hard to automate.
Thanks
Hi Nunno,
This is obviously a rounding error. It is up to you to decide how to round figures in practice. Usually rounding up to 4 decimal digits is considered a solid practice. Please don't worry too much about this issue as the focus of the lessons is to learn the principles and logic of the tests you are performing.
Best,
Ned
Thank you for sharing the excel formula. This is very helpful, as excel is doing the hard work, and I will be foucusing on the interpertation of the results.
By the way you have an error in cell# F79. i.e, you used alpha of 0.05 which is incorrect
you should use alpha = 0.995 since the confidence interval is 99% (0.99 +-0.005 from each side)
so, the correct excel formula to use is:
=T.INV(0.995,8) = 3.35538733
Hope you find this helpful