Financial Ratio Analysis in Forecasting: Tools, Techniques, and Real-World Applications
Financial ratio analysis is a cornerstone of accurate financial forecasting—helping analysts project future performance based on historical data. When combined with tools like sensitivity analysis and scenario analysis, it offers a more dynamic and realistic view of potential outcomes—empowering better financial planning and decision-making.
Join over 2 million professionals who advanced their finance careers with 365. Learn from instructors who have worked at Morgan Stanley, HSBC, PwC, and Coca-Cola and master accounting, financial analysis, investment banking, financial modeling, and more.
Start for Free
Forecasting is at the core of financial planning and decision-making. From projecting revenues to estimating future profitability, analysts rely on various tools and methods to predict a company’s financial future. Among the most foundational of these are financial ratio analysis and trend modeling, but a complete forecast also includes advanced tools, such as sensitivity analysis, scenario planning, and simulation models.
Understanding Financial Forecasting
When you hear the word “forecast,” concepts like prediction, uncertainty, and probability likely come to mind. In finance, forecasting refers to predicting a company’s future performance. Financial analysts essentially act as forecasters of a company’s “financial weather”—projecting performance over months, years, or even decades.
One key method analysts use is financial ratio analysis, which provides a framework for understanding how past performance might shape future results.
Forecasting with Ratio Analysis
Financial forecasting often begins with historical financial statements—specifically, common-size income statements, balance sheets, and cash flow statements. By analyzing ratios derived from these documents, analysts can identify patterns that inform future projections.
Take, for example, the performance of SaleSmart (a hypothetical retail technology firm) over the past three years. The company has demonstrated steady financial growth, with annual revenue increasing by 10%, driven by expanding market share and improved customer retention strategies.
During the same period, cost of goods sold (COGS) has risen at a slightly lower rate of 8% annually—reflecting efficient supply chain management and economies of scale. As a result, gross profit has grown by 17% per year—a sign of SaleSmart’s increasing operational leverage.
An analysis of the Gross Profit Margin (GPM) reveals a consistent upward trend of 1.4 percentage points annually—indicating not only growth in absolute profits but also improvement in profitability ratios. This kind of steady improvement is referred to as a historical trend—often used in forecasting future financial performance.
To extend this trend into the future, we can assume the GPM continues to grow at the same annual rate of 1.4 percentage points—reaching 24.8% in Year 4, 25.1% in Year 5, and so on.
If COGS continues to rise at a fixed 8%, we can use the GPM formula to estimate future revenue:
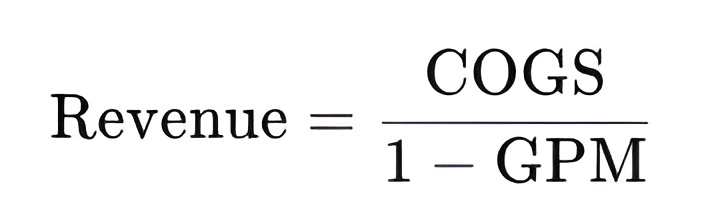
By projecting both revenue and gross profit, we can build a five-year financial model—useful, yet based on the assumption that key financial relationships remain unchanged.
Limitations of Trend-Based Forecasting
While historical trend analysis and financial ratio analysis provide valuable insights, they have limitations. Chief among them is the assumption that past relationships will remain stable. This often does not reflect reality.
For example, a company may plan a significant restructuring, launch a new product, or acquire a competitor—events that can dramatically alter financial outcomes. Furthermore, historical data excludes strategic initiatives or external economic shifts. This creates a gap between what the numbers suggest and what might occur.
Additionally, favorable financial ratios alone should not be taken as definitive indicators of success. They do not capture the full complexity of a business’s operations. Accurate forecasting requires a broader perspective that incorporates both quantitative and qualitative factors.
Beyond Ratios: Advanced Forecasting Techniques
To supplement traditional analysis, financial professionals utilize advanced forecasting tools, including sensitivity analysis, scenario analysis, and simulation models.
Sensitivity Analysis
Sensitivity analysis examines how changes in one variable affect another. For instance, what happens to profit if marketing expenses rise by 5%? Or if cost inputs increase by 3%?
While financial ratio analysis offers a snapshot of historical performance, sensitivity analysis enables decision-makers to identify which inputs have a significant influence on outcomes. It’s beneficial when evaluating revenue drivers, such as product offerings, seasonality, and consumer demand.
Scenario Analysis
Scenario planning models various possible futures. Analysts typically define:
- Base-case scenario (most realistic)
- Worst-case scenario
- Best-case scenario
For SaleSmart, the base case assumes a steady growth in GPM of 1.4%. A worst-case scenario might involve GPM stagnating at 24.4%—requiring higher revenues to sustain gross profit. Conversely, a best-case scenario might project 5% annual GPM growth, yielding significantly higher revenues.
Simulation Modeling
Simulation modeling combines multiple variables that change over time to create a more dynamic forecast. For example:
- What if both revenue and COGS increase by 4% annually?
- What if GPM grows by 2%, then 3%, then 4%, etc.?
Simulations enable analysts to test outcomes under various conditions—creating more robust and realistic financial plans.
The Power of Financial Ratio Analysis in Forecasting
Financial forecasting is as much an art as it is a science. While financial ratio analysis and historical trends provide a solid starting point, a comprehensive forecast requires a mix of techniques.
The most accurate models integrate historical insights with flexible tools—such as sensitivity and scenario analysis—enabling businesses to adapt to change. Ultimately, the more forecasting methods you master, the more valuable your analysis becomes—and the more informed your financial decisions will be.
Let your imagination guide the models you build, and you’ll unlock more profound insights from every financial data set.
To deepen your expertise and gain hands-on experience with these forecasting techniques, consider joining the 365 Financial Analysis platform—where expert-led training and real-world projects help turn theory into actionable insight.