Understanding Asset Management Ratios in Working Capital Management
Asset management ratios are crucial tools for evaluating a company’s efficiency in utilizing its assets to support sales and operations. This guide explores key ratios (accounts receivable turnover, days of receivables, inventory turnover, and days of inventory) and explains their role in effective working capital management.
Join over 2 million professionals who advanced their finance careers with 365. Learn from instructors who have worked at Morgan Stanley, HSBC, PwC, and Coca-Cola and master accounting, financial analysis, investment banking, financial modeling, and more.
Start for Free
In the realm of financial analysis, asset management ratios (efficiency ratios) play a vital role in assessing how effectively a company utilizes its assets to generate sales. These ratios are fundamental within the broader framework of working capital management, which focuses on the efficient use of current assets and liabilities.
This guide examines key asset management ratios, including accounts receivable turnover, days of receivables, inventory turnover, and days of inventory on hand. Understanding and interpreting these metrics enables better operational and financial decision-making.
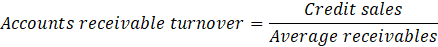
1. Accounts Receivable Turnover: Measuring Credit Efficiency
The accounts receivable (AR) turnover ratio measures a company’s efficiency in managing its credit sales and collecting payments from customers. It’s calculated as:
This ratio helps answer two key questions of a company’s financial performance:
- How many times does the company convert its receivables into cash during a specific period?
- How efficiently does it collect payments from customers?
Interpreting the Ratio
As part of asset management ratios, a high turnover ratio generally suggests that customers are paying promptly and that the company has an effective collections process. But if the ratio is extremely high, it may indicate that the company is overly strict with its credit policies or operates primarily on a cash basis, which could potentially limit sales growth. Conversely, a low turnover ratio may signal weak credit controls, ineffective collections, or financially unstable customers.
2. Days of Receivables: Translating Turnover into Time
To provide a clearer picture of payment collection efficiency, the accounts receivable turnover can be translated into days sales outstanding (DSO)—also known as days of receivables:

This conversion reveals the average number of days it takes customers to pay their invoices. For example, if the ratio is 30, it means that customers typically take 30 days to settle their accounts.
To assess whether 30 days is good or bad, compare it with the industry average:
- A more extended collection period than industry peers suggests that too much capital is tied up in receivables, impacting liquidity.
- A shorter-than-average period might indicate overly strict credit terms, potentially deterring customers who prefer more flexible payment options.
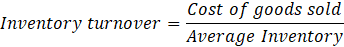
3. Inventory Turnover: Evaluating Inventory Efficiency
Let’s examine how efficiently a company manages its inventory. The inventory turnover ratio is calculated as:
This ratio, part of asset management ratios, indicates how often the company sells and replaces its inventory within a specified period. For instance, a ratio of 3 implies the entire inventory was sold and replenished three times during the time frame.
A high inventory turnover suggests strong sales and efficient inventory management—provided the company avoids stockouts that could lead to missed sales. On the other hand, a low turnover might indicate overstocking, outdated inventory, or weak sales.
4. Days of Inventory: Translating Turnover into Holding Time
To further interpret inventory turnover, we convert it into days of inventory:

This figure (the average inventory period) indicates how long the inventory stays on hand before being sold. For example, a 115-day inventory period means products sit in storage for nearly four months on average.
Contextual Interpretation
Industry norms play a crucial role in interpreting inventory turnover—a key component of asset management ratios. Luxury retailers—such as Tiffany & Co. or companies in sectors like furniture and homebuilding—can afford longer inventory cycles. In contrast, grocery stores or fast-moving consumer goods (FMCG) companies, such as Walmart, require faster turnover to prevent spoilage or outdated inventory.
An unusually high number of inventory days compared to competitors could signal excess capital tied up in inventory. On the other hand, a too low number may indicate insufficient stock, resulting in lost sales when demand cannot be met.
Asset Management Ratios: Balancing Efficiency and Opportunity
Asset management ratios are critical indicators of a company’s operational efficiency because they help reveal how effectively a firm converts receivables into cash, manages its inventory, and utilizes current assets to support sales.
These ratios (accounts receivable turnover, days of receivables, inventory turnover, and days of inventory) should never be interpreted in isolation. Instead, they must be evaluated against industry benchmarks and company-specific circumstances.
Ultimately, effective working capital management strikes a balance—maintaining enough flexibility to support customer relationships and sales, while avoiding excessive capital tied up in assets that could otherwise be invested elsewhere for higher returns.
By mastering the interpretation of these ratios in context, you can gain deeper insights into business performance—skills you can build and apply with confidence through the hands-on training offered by the 365 Financial Analysis platform.