Common Chart Patterns in Technical Analysis of Financial Markets
Discover how common chart patterns like Head and Shoulders, Double Tops, and Triangles can signal potential market moves. This guide breaks down key reversal and continuation patterns with real-world examples to help traders make more informed decisions.
Join over 2 million professionals who advanced their finance careers with 365. Learn from instructors who have worked at Morgan Stanley, HSBC, PwC, and Coca-Cola and master accounting, financial analysis, investment banking, financial modeling, and more.
Start for FreeIn the world of financial trading, technical analysis involves much more than identifying support and resistance levels. The real advantage comes from interpreting common chart patterns that often go unnoticed by less experienced traders. This article explores two essential categories of chart patterns: reversal patterns, which signal potential trend changes, and continuation patterns, which suggest the current trend may continue.
Reversal Patterns
Reversal patterns signal that a prevailing trend is likely to change direction. These patterns often occur after a strong price movement and suggest a shift in market sentiment.
Head and Shoulders
One of the most well-known reversal patterns is the Head and Shoulders. It typically appears after an uptrend and indicates a potential shift to a downtrend.
This pattern consists of three peaks:
- Left shoulder
- Head (the highest point)
- Right shoulder (typically lower than the head)
Using Tesla’s one-year price chart, we can identify the three components. Once this pattern is complete, it suggests that the demand driving the price upward is weakening, and a downward reversal is likely—as indeed happened with Tesla.
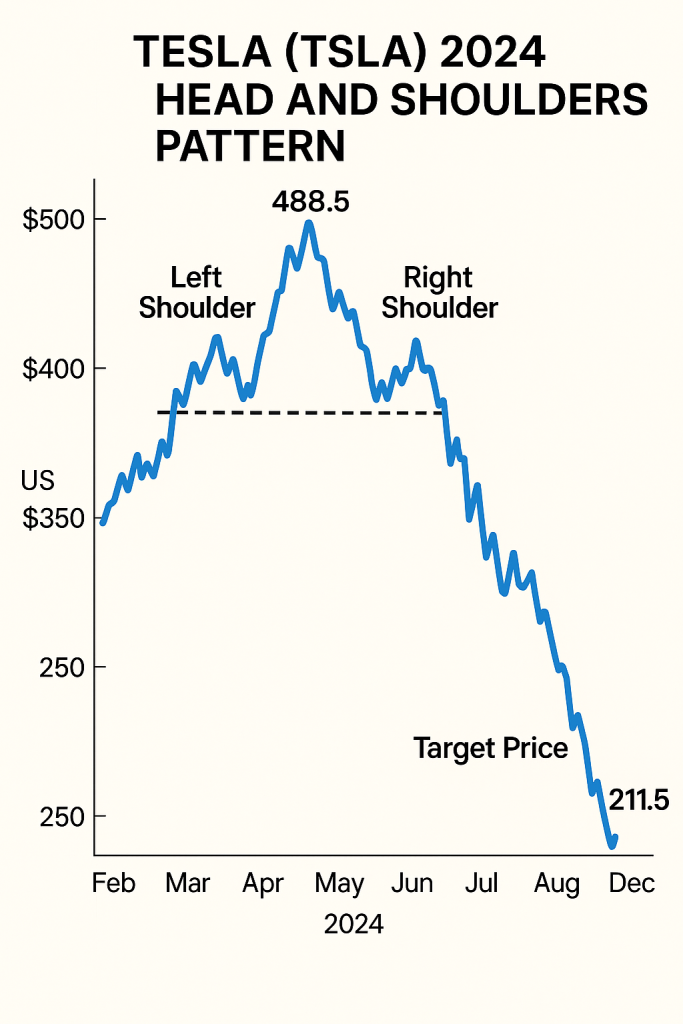
Tesla’s 2024 Head and Shoulders Breakdown
- Left Shoulder: Formed in early March 2024, with TSLA peaking around $420.
- Head: The stock reached its highest point in mid-April 2024, peaking at $488.50.
- Right Shoulder: In early June 2024, TSLA rose to approximately $420 again but failed to surpass the previous high, indicating weakening momentum.
- Neckline: A support level established around $350—connecting the lows after the left and right shoulders.
Target Price Calculation
Using the Head and Shoulders pattern, the projected price target after a breakdown is calculated as follows:
- Target Price = Neckline − (Head − Neckline)
- Substituting the values: Target Price = $350 − ($488.50 − $350) = $350 − $138.50 = $211.50
This calculation suggests a potential decline to approximately $211.50.
Following the breakdown below the neckline in late June 2024, Tesla’s stock experienced a significant drop, closely aligning with the projected target. This movement highlights the reliability of the Head and Shoulders pattern as a tool for anticipating bearish reversals in stock trends.
Inverse Head and Shoulders
The inverse head and shoulders is one of the common chart patterns and the opposite of the traditional pattern. It occurs after a downtrend and indicates a possible move higher. This pattern forms when the stock price creates a low (the head) between two higher lows (the shoulders), as seen in this example of Disney’s stock in 2024.
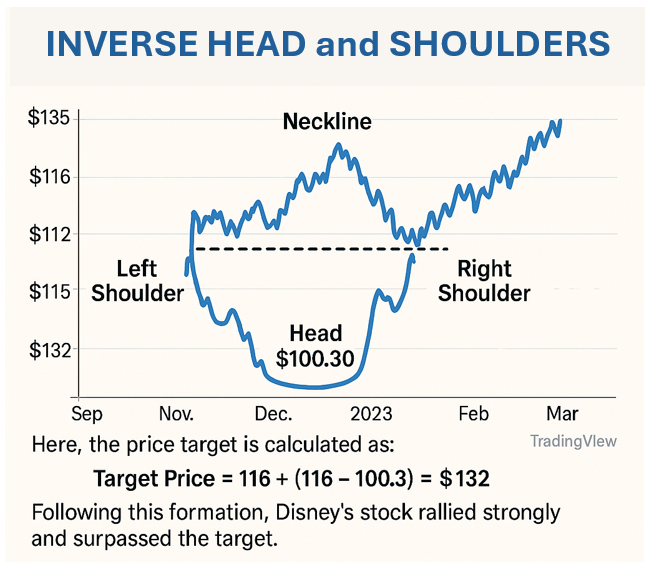
Disney’s Inverse Head and Shoulders Breakdown
- Left Shoulder: The stock experienced a low point, followed by a temporary rally.
- Head: A subsequent decline led to a lower trough, marking the head of the pattern.
- Right Shoulder: The price rose again, dipped to a higher low than the head, and began ascending.
- Neckline: A resistance level formed by connecting the peaks after the left shoulder and the head, approximately at $116.
Price Target Calculation
To estimate the potential upward movement following the breakout, the following formula is used:
- Target Price = Neckline + (Neckline – Head)
- Substituting the values: Target Price = $116 + ($116 – $100.30) = $116 + $15.70 = $131.70
This calculation suggests a potential rise to approximately $131.70.
Following the breakout above the neckline, Disney’s stock rallied and surpassed the projected target, confirming the bullish reversal indicated by the inverse head and shoulders pattern.
Double and Triple Tops
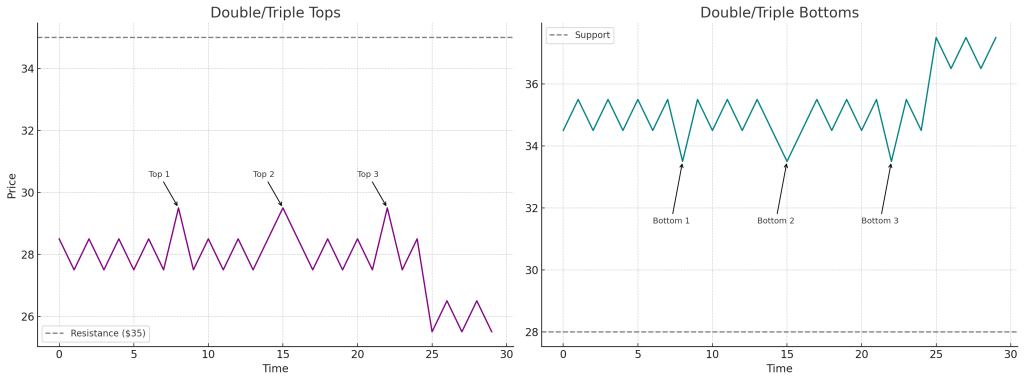
Double and triple tops are common chart patterns and classic reversal patterns after an uptrend. They indicate that the stock has failed to break through a resistance level two or three times, suggesting that buying momentum is fading.
Double and Triple Bottoms
In contrast, double and triple bottoms occur after a downtrend and signal a possible trend reversal upward. These patterns show that the price has tested a support level multiple times without breaking below it—implying strong buying interest.
Continuation Patterns
Continuation patterns are common chart patterns that suggest that the current trend (up or down) will likely resume after a brief consolidation or pause. These patterns often reflect a temporary shift in ownership between traders before the original trend continues.
Triangles
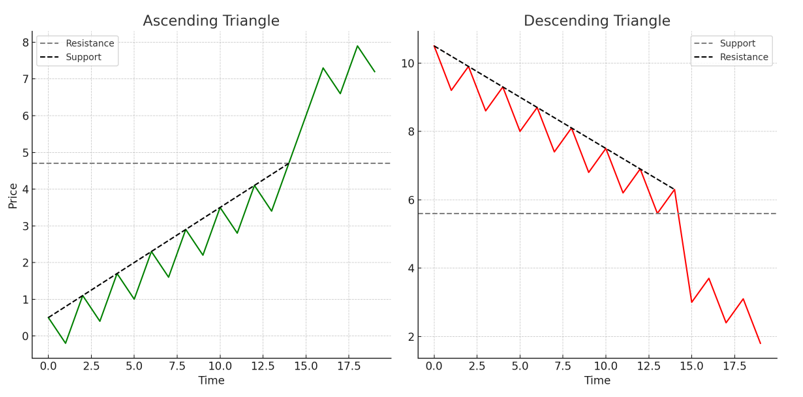
Triangles are common continuation patterns and come in two primary forms.
1. Ascending Triangle
The top trendline is flat in an ascending triangle, while the bottom trendline slopes upward. This indicates that sellers hold the price at a certain resistance level, but buyers are becoming increasingly aggressive and willing to pay higher prices. This setup often leads to an upward breakout.
2. Descending Triangle
A descending triangle is the opposite. The bottom trendline remains flat, indicating steady support, while the top trendline slopes downward. This shows that buyers resist at the same level, but sellers push prices lower—often resulting in a downward breakout.
Symmetrical Rectangle: Bullish/Bearish
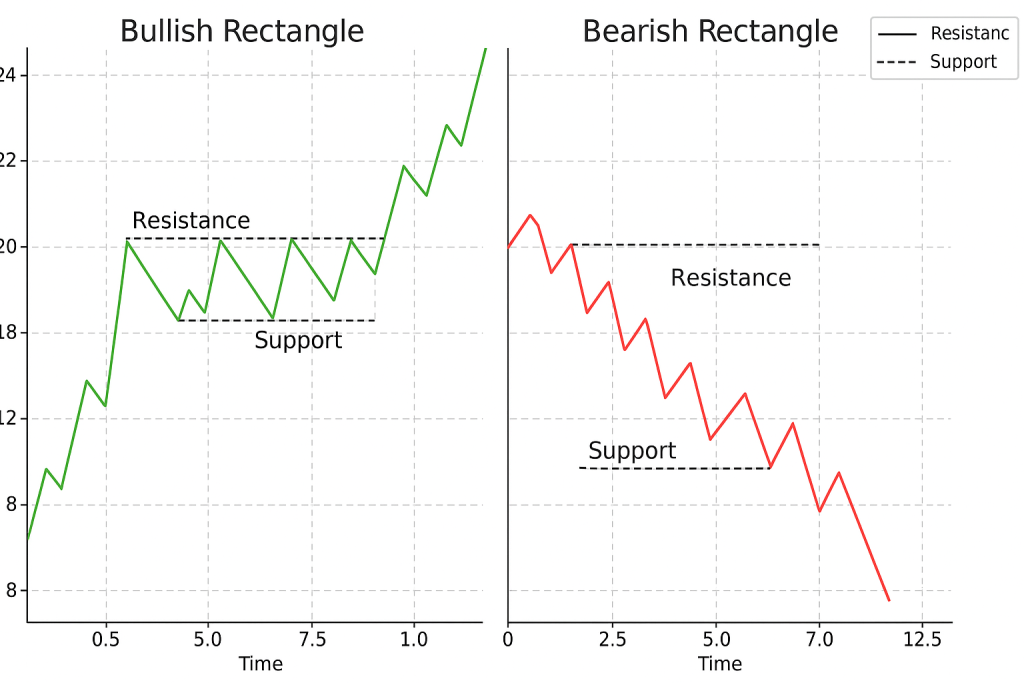
Another common chart pattern that signals potential continuation in market trends is symmetrical rectangles (bullish or bearish). These rectangles form when the price moves sideways between consistent support and resistance levels. This represents a period of consolidation where buyers and sellers are in balance. A bullish rectangle occurs during an uptrend, resulting in an upward breakout. A bearish rectangle forms in a downtrend and often leads to further declines.
Making Sense of Common Chart Patterns
Common chart patterns like Head and Shoulders, Double Tops, and Triangles offer valuable signals about potential trend shifts or continuations. But, while useful, these patterns aren’t foolproof and should be combined with other indicators and sound risk management. With practice, they can become powerful tools in a trader’s decision-making process.
To deepen your understanding and apply these concepts with confidence, consider joining the 365 Financial Analyst platform for structured, expert-led learning.
