The Money-Weighted Rate of Return (MWRR)
The money-weighted rate of return (MWRR) is a key metric for evaluating the impact of investment timing and cash flow amounts on overall portfolio performance. Unlike other methods, MWRR reflects the actual return an investor experiences by accounting for the timing of fund additions and withdrawals. This makes it especially useful for assessing personal investment outcomes.
Join over 2 million professionals who advanced their finance careers with 365. Learn from instructors who have worked at Morgan Stanley, HSBC, PwC, and Coca-Cola and master accounting, financial analysis, investment banking, financial modeling, and more.
Start for Free
Evaluating the performance of an investment portfolio requires more than just tracking gains and losses. One useful metric is the money-weighted rate of return (MWRR), which considers both the size and timing of cash flows. This article focuses on understanding how MWRR is calculated, what it represents, and what its strengths and limitations are in assessing portfolio performance.
What Is the Money-Weighted Rate of Return?
The money-weighted rate of return is the internal rate of return (IRR) applied in an investment context. It considers the timing and size of all cash flows into and out of the portfolio. The MWRR is defined as the discount rate that equates the present value of cash outflows (investments) with the present value of inflows (returns and withdrawals).
In simpler terms, MWRR reflects how much return the investor earned based on when and how much they invested. As a result, MWRR is influenced not only by the performance of the underlying assets but also by the investor’s own decisions about when to add or withdraw funds.
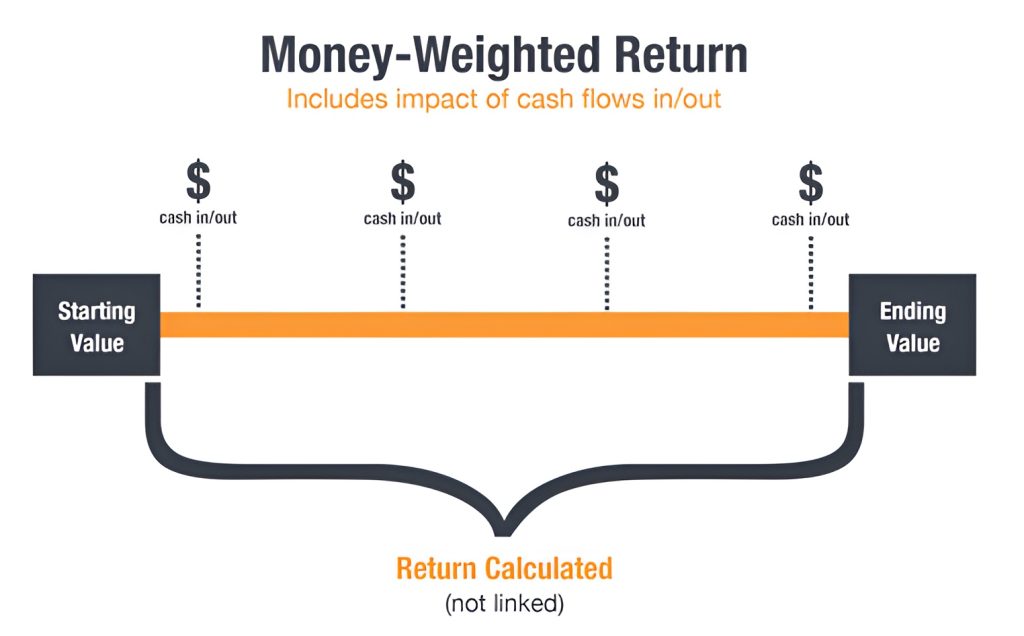
Figure: The money-weighted return includes the impact of cash flows in and out of the portfolio.
Calculating MWRR
Let’s consider an example to illustrate how a money-weighted rate of return is calculated. John invests in Walmart shares over two years:
- At time 0, he purchases one share at $65.
- At the end of Year 1, he buys another share for $72.
- At the end of Year 2, he sells both shares for a total of $234.
- The stock pays a $5 dividend per share each year.
Step-by-Step Cash Flow Breakdown
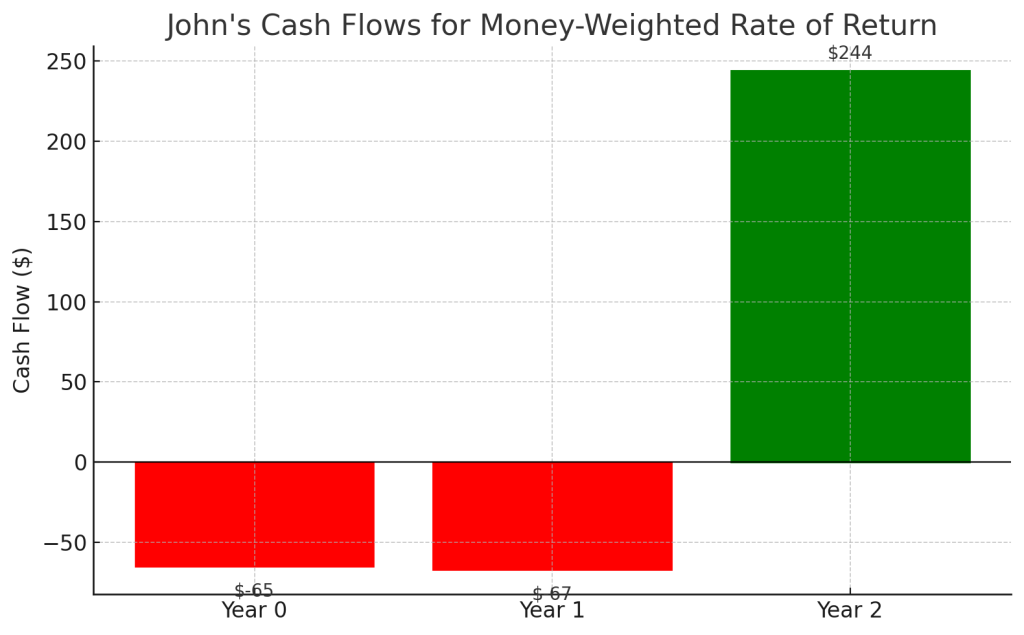
We identify the cash flows from John’s perspective:
- Year 0 (t = 0): Outflow of $65 for the first share.
- Year 1 (t = 1): Net outflow of $67 ($72 purchase minus $5 dividend).
- Year 2 (t = 2): Inflow of $244 ($234 from sale + $10 from two dividends).
Using these cash flows, we apply the IRR formula to determine the discount rate r that equates the present value of cash inflows to the present value of cash outflows:
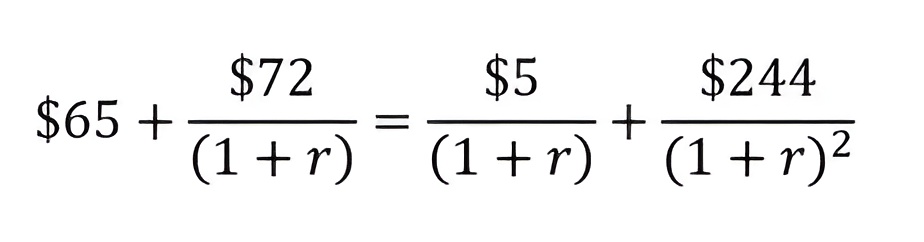
This equation represents:
- An outflow of $65 at time 0
- A net outflow of $67 at time 1 (a $72 purchase minus a $5 dividend)
- An inflow of $244 at time 2 (sale proceeds plus dividends)
Solving this equation manually is complex, so we use a financial calculator or spreadsheet to compute the internal rate of return. The result is a money-weighted rate of return of 48.95%, indicating a strong return based on both asset performance and the timing of John’s investments.
Comparing with the Time-Weighted Rate of Return
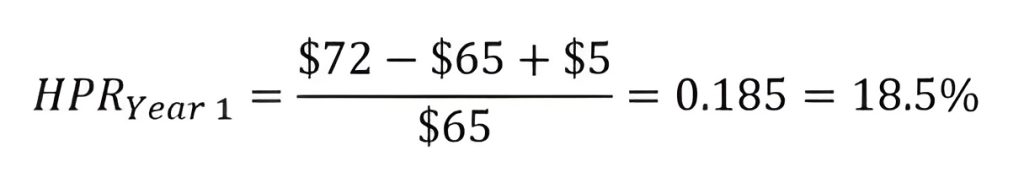
To better understand the implications of MWRR, we compare it with a time-weighted approach by calculating the holding-period return for each year.
- Year 1 Return:
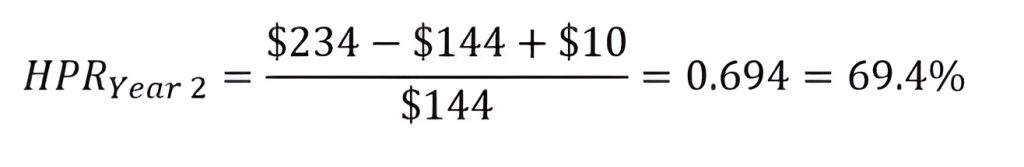
- Year 2 Return:
- Average:
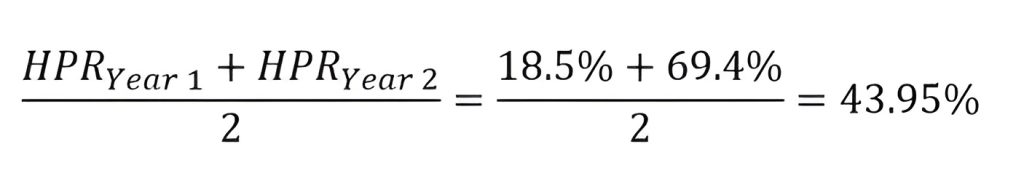
This average return is lower than the money-weighted rate of return of 48.95%—highlighting how the MWRR is skewed by larger investments made in periods of higher returns.
Strengths and Limitations of MWRR
Strengths:
- MWRR accurately reflects the investor’s personal experience by accounting for the size and timing of cash flows.
- It’s helpful for individuals assessing the return on their actual invested capital.
Limitations:
- MWRR can be misleading for evaluating portfolio manager performance since the investor controls cash flow timing—not the manager.
- It’s heavily influenced by periods when more money was invested, regardless of underlying asset performance.
Because of these drawbacks, professionals often favor the time-weighted rate of return, which removes the impact of external cash flows and better isolates the manager’s skill.
Alternative Example of MWRR Calculation
To further reinforce the calculation and interpretation of the money-weighted rate of return, consider a second scenario illustrated below:
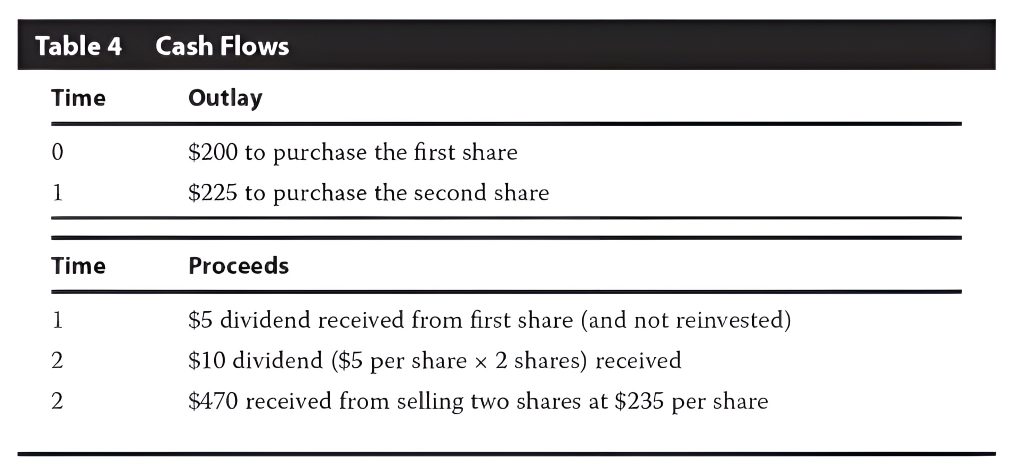
Table: Cash flows related to the purchase, dividends, and sale of shares.
In this case:
- At time 0, the investor buys a share for $200.
- At time 1, they buy another for $225 and receive a $5 dividend from the first share.
- At time 2, they receive $10 in dividends and sell both shares for $470.
These values can be entered into a financial calculator (or a spreadsheet’s IRR function) to calculate the money-weighted rate of return for this investment. As with John’s case, the MWRR will be affected not only by the performance of the assets but also by the timing and size of the investor’s contributions.
Evaluating Performance with the Money-Weighted Rate of Return
The money-weighted rate of return is a valuable tool for understanding how an investor’s portfolio performs, taking into account both the asset’s performance and the timing of cash flows. While it reflects the real return experienced by the investor, it may not fairly measure the skill of a portfolio manager due to its sensitivity to when funds are added or withdrawn. Understanding how MWRR works—and its limitations—helps investors interpret results more clearly and use them appropriately in performance evaluation.
Building this kind of analytical insight is crucial for making informed investment decisions—something the 365 Financial Analyst platform is designed to support through structured learning and real-world applications. You can start learning for free and take the first step toward mastering key financial concepts.