Determining the optimal capital budget using the marginal cost of capital and investment opportunity schedule
Discover how the marginal cost of capital (MCC) and the investment opportunity schedule (IOS) work together to guide smart capital budgeting decisions. This guide explains how to visualize MCC and IOS, rank projects by IRR, and determine the optimal capital budget to maximize shareholder value.
Join over 2 million professionals who advanced their finance careers with 365. Learn from instructors who have worked at Morgan Stanley, HSBC, PwC, and Coca-Cola and master accounting, financial analysis, investment banking, financial modeling, and more.
Start for Free
Capital budgeting is a critical financial decision-making process that helps firms allocate resources to investment opportunities with the highest potential returns. Two essential tools in this process include the marginal cost of capital (MCC) and the investment opportunity schedule (IOS). Together, they enable companies to determine which projects will maximize shareholder value by ensuring the internal rate of return (IRR) exceeds the cost of capital. This guide explains how these tools work and how they combine to define the optimal capital budget.
Understanding the WACC
The weighted average cost of capital (WACC) represents the average rate of return a firm must offer to investors (equity holders and creditors) to finance its assets. For example, company Beta’s WACC is estimated at 6.4%. This implies that any project generating a return above this threshold will add value to the company.
WACC, however, is not static. As a firm raises additional capital, the cost of that capital increases due to rising financial risks, such as debt overload or investor demand for higher returns. This dynamic increase is typically shown graphically using the marginal cost of capital (MCC) schedule.
Why MCC Increases with New Capital
The marginal cost of capital reflects the rising cost of capital as more funds are raised. When companies issue more debt or equity, investors perceive greater risk—especially if the firm’s debt ratio increases. As a result, they demand higher returns, pushing up the firm’s overall cost of capital.
Visualizing the MCC Curve
The marginal cost of capital schedule is graphed with the cost of capital on the vertical axis and the cumulative amount of capital raised on the horizontal axis. The result is an upward-sloping curve, illustrating how the cost of capital increases as the firm raises more funds. This visualization helps decision-makers understand that capital cannot be raised indefinitely at a constant rate.
The Investment Opportunity Schedule (IOS)
What is the IOS?
The investment opportunity schedule (IOS) ranks all potential investment projects by their internal rate of return (IRR), from highest to lowest. Each project is accompanied by an initial cost and an expected return. As the firm undertakes more projects, it must raise additional capital, which becomes increasingly expensive to do so.
Ranking Projects by IRR
To construct an IOS, first rank the projects in descending order based on their IRR. Then, calculate the cumulative capital required to finance each project in sequence.
For example, if the company Sigma has five projects, B, E, C, F, and G (as illustrated below), we begin by selecting the one with the highest IRR. If the cumulative capital needed to undertake projects B, E, and C is $5,050,000, and their IRRs exceed the marginal cost of capital at this level, they are accepted.
Graphing the IOS
The IOS is plotted with IRR on the vertical axis and cumulative capital cost on the horizontal axis. Each project is typically represented by a rectangle, where the height reflects the IRR and the width represents the initial cost of the project. As more projects are added from highest to lowest IRR, the graph forms a descending staircase pattern—visually reinforcing how returns diminish as more capital is deployed.
Combining MCC and IOS to Determine the Optimal Capital Budget
The Point of Intersection
The marginal cost of capital curve and theinvestment opportunity schedule can be plotted together on the same graph. The optimal capital budget is found at the intersection point, where the IRR of the last acceptable project equals the MCC. This is the point at which the company stops accepting new projects because any further investments would have returns lower than their cost of capital.
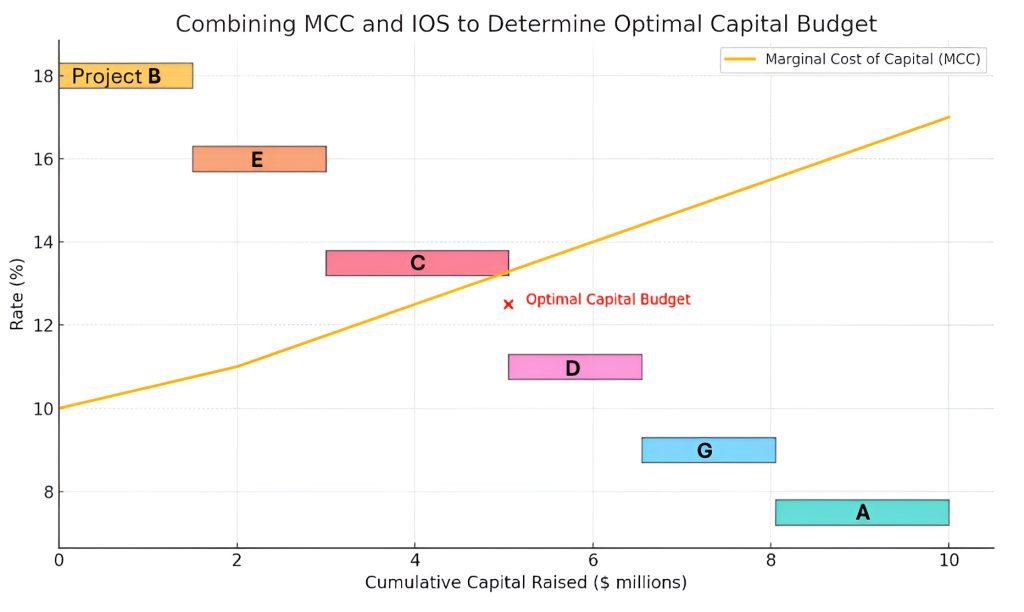
Combining the MCC curve with the IOS. Projects are represented as rectangles ranked by IRR, while the MCC curve slopes upward as more capital is raised. The red cross indicates the optimal capital budget—where the last project’s IRR equals the cost of capital.
Maximizing Net Present Value (NPV)
A project should be accepted if its IRR exceeds the marginal cost of capital and generates a positive net present value (NPV).
The greater the difference between a project’s IRR and the cost of capital, the higher its NPV. Therefore, accepting projects in descending order of IRR until the IRR equals the MCC maximizes total NPV.
Graphically, this is shown by selecting all rectangles on the IOS graph that are positioned above the MCC curve. The area under the IOS but above the MCC represents value-creating projects.
If Sigma’s WACC is 12.5% and the firm can raise up to $5,050,000, only projects B, E, and C (all with IRRs above 12.5%) should be accepted. Projects D, G, and A—offering lower returns—should be rejected. The total cost of the accepted projects represents the optimal capital budget. On the combined graph, this is the horizontal point at which the IOS staircase last stands above the marginal cost of capital curve.
Adjusting WACC for Project-Specific Risk
When to Adjust the WACC
Using the firm’s overall WACC assumes that the project’s risk is similar to that of the firm’s existing operations. But when a project carries higher or lower risk, the WACC must be adjusted accordingly.
Real-World Application
- Same-Risk Projects: For instance, if Burger King launches a new restaurant, the corporate WACC can serve as the discount rate.
- Different-Risk Projects: If a pharmaceutical company considers investing in real estate, the different risk profile demands an adjusted WACC to reflect investor expectations.
Adjusting for Risk
To estimate an appropriate discount rate:
- Higher-risk projects → Increase the WACC
- Lower-risk projects → Decrease the WACC
One method used for this is the pure-play method, which estimates WACC based on comparable companies operating solely in the same industry as the proposed project. Once adjusted, this WACC is used to compute the NPV:
- Positive NPV → Accept the project
- Negative NPV → Reject the project
This approach ensures each investment is evaluated based on its specific risk-return profile.
Maximizing Value: Capital Budgeting and Marginal Cost of Capital
Determining the optimal capital budget requires an integrated approach using both the marginal cost of capital (MCC) and the investment opportunity schedule (IOS). The MCC reflects the increasing cost of capital as more funds are raised, while the IOS ranks available projects based on IRR. Visualizing these tools as graphs makes it easier to pinpoint the decision threshold. By accepting projects whose IRRs exceed the marginal cost of capital—and stopping at the point where IRR equals MCC—firms can maximize total net present value and enhance shareholder value.
When projects carry different risk profiles, adjusting the WACC ensures that capital budgeting decisions remain accurate and aligned with investor expectations. Ultimately, the point where the MCC curve intersects the IOS staircase defines the optimal capital budget—the investment level that optimally balances risk, return, and long-term firm value.
To deepen your understanding and apply these essential principles with confidence, join the 365 Financial Analysis platform—where expert-led courses, practical tools, and real-world case studies bring capital budgeting concepts like MCC and IOS to life.