Estimating the Cost of Equity Capital: A Strategic Approach
Estimating the cost of equity is essential for making informed investment and valuation decisions. This article explores three key approaches (CAPM, the Dividend Discount Model, and the Bond Yield Plus Risk Premium), each offering unique insights based on risk, dividends, or bond yields. Understanding these methods helps analysts choose the most appropriate model for various financial contexts.
Join over 2 million professionals who advanced their finance careers with 365. Learn from instructors who have worked at Morgan Stanley, HSBC, PwC, and Coca-Cola and master accounting, financial analysis, investment banking, financial modeling, and more.
Start for Free
The cost of equity represents the return that a company’s shareholders require on their investment in the firm’s equity. Unlike the cost of debt, which is often clearly observable through interest rates, estimating the cost of equity is inherently more complex. Investors do not declare their expected return, so analysts must rely on financial models to approximate this figure.
Three of the most widely accepted models for calculating the cost of equity are the Capital Asset Pricing Model (CAPM), the Dividend Discount Model (DDM), and the Bond Yield Plus Risk Premium approach. Each method has its own rationale, application, and limitations—making it essential to understand their mechanics and context.
1. The Capital Asset Pricing Model (CAPM)
CAPM is perhaps the most frequently used method for estimating the cost of equity—introduced in the 1960s and still considered foundational in finance today. The model suggests that a stock’s expected return is a function of the risk-free rate, the sensitivity of the stock to market movements (beta), and the market risk premium. Specifically, it is expressed as:

Here, RF represents the risk-free rate—typically approximated using long-term government securities like U.S. Treasury bonds. The reflects how volatile a company’s returns are about the broader market, and RM−RF is the market risk premium, which represents the additional return investors expect from holding risky market assets instead of risk-free ones.
To illustrate, consider the case of Beta Corporation. The firm is exploring investment opportunities with characteristics like its existing operations, which have a beta of 1.5. Assuming a risk-free rate of 4% and a market risk premium of 8%, the cost of equity is calculated as:
E(Ri) = 4% + 1.5 [8%] = 16%
CAPM also underscores the importance of selecting parameters that match the investment context. For instance, if a project has a five-year duration, the five-year treasury bond yield should be used as the risk-free rate. Similarly, the market risk premium can be estimated using different approaches, such as analyzing historical data, applying dividend-based models, or conducting expert surveys.
One common practice is to use historical data to estimate the market risk premium. For example, by comparing the long-term average return of a market index like the Wilshire 5000 to the average risk-free rate, one can derive a reliable premium. If Apple Inc. has a beta of 1.23, the 10-year Treasury bond yield is 4.4 percent, and the historical equity premium is estimated at 5.3 percent, then Apple’s cost of equity would be:
E(Ri) = RF + βi [E(RM) − RF] = 4.4% + 1.23 × 5.3% = 10.9%
2. The Dividend Discount Model (DDM)
The Dividend Discount Model offers an alternative approach by valuing equity based on future dividend payments. This method is particularly useful for companies with stable dividend policies. The most used version is the Gordon Growth Model, which assumes that dividends will grow at a constant rate indefinitely. The formula is:
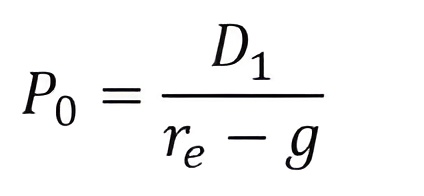
In this equation:
- P0 is the current market price of the stock.
- D1 is the expected dividend in the next period.
- re is the cost of equity.
- g is the expected constant growth rate of dividends.
To estimate the growth rate, analysts often calculate the sustainable growth rate, which reflects the rate at which a company can grow its dividends without changing its capital structure. This is computed as the product of the retention ratio (1 minus the dividend payout ratio) and the return on equity (ROE). For instance, if Beta Corporation retains 70 percent of its earnings and has an ROE of 12 percent, the sustainable growth rate would be:
0.70 × 12% = 8.4%
Suppose Beta’s current stock price is $25, and the next expected dividend is $2. Using the model:
Cost of Equity = (Dividend / Price) + Growth Rate
= ($2 / $25) + 8.4%
= 8% + 8.4% = 16.4%
The DDM can also be employed to estimate the equity risk premium. For example, if the dividend yield of the S&P 500 is 8% and the dividend growth rate is 3%, then the expected market return is 11%. If the risk-free rate is 2%, the equity risk premium is 9%.
3. The Bond Yield Plus Risk Premium Approach
The Bond Yield Plus Risk Premium (BYPRP) approach is grounded in a fundamental financial principle: investors demand higher returns for taking on greater risk. Equity investments are riskier than bonds, primarily because debt holders are paid before shareholders in the event of bankruptcy and often have security or collateral. As a result, equity holders expect a premium above what bondholders receive.
This method estimates the cost of equity by adding a subjective risk premium to the company’s bond yield:
Cost of Equity = Bond Yield + Risk Premium
This approach is especially useful for private companies or firms without a consistent dividend history. For example, if Beta Corporation’s bonds yield 6%, and the estimated risk premium is 3%, then the cost of equity would be:
6% + 3% = 9%
Although straightforward, this approach relies heavily on expert judgment and may lack the precision of models like CAPM.
Comparing Methods
When applied to the Beta Corporation, the three methods may yield significantly different results. The estimates are as follows:
- CAPM: 16.0%
- Dividend Discount Model: 16.4%
- Bond Yield Plus Risk Premium: 9.0%
This variation is not uncommon in real-world practice. Estimating the cost of equity involves judgment, assumptions, and different data inputs, all of which can influence the outcome.
The Cost of Equity: Choosing the Most Appropriate Method
Each method for estimating the cost of equity (CAPM, DDM, and the Bond Yield Plus Risk Premium) has its advantages depending on the context. CAPM, however, is generally favored for its ability to adjust for risk and its applicability even when dividend data is unavailable. It remains the most widely used approach in both academic and corporate finance, offering a solid foundation for investment and valuation decisions. When possible, comparing results from multiple models can provide a more balanced perspective.
To build a solid foundation in applying and comparing models like CAPM, DDM, and the Bond Yield Plus Risk Premium in real-world valuation scenarios, consider joining the 365 Financial Analysis platform for practical, hands-on learning.