Technical Analysis
Unlock the power of technical analysis: Learn to spot market trends and make smart trading decisions
 Start for free
What you get:
- 1 hour of content
- 14 Interactive exercises
- World-class instructor
- Closed captions
- Q&A support
- Future course updates
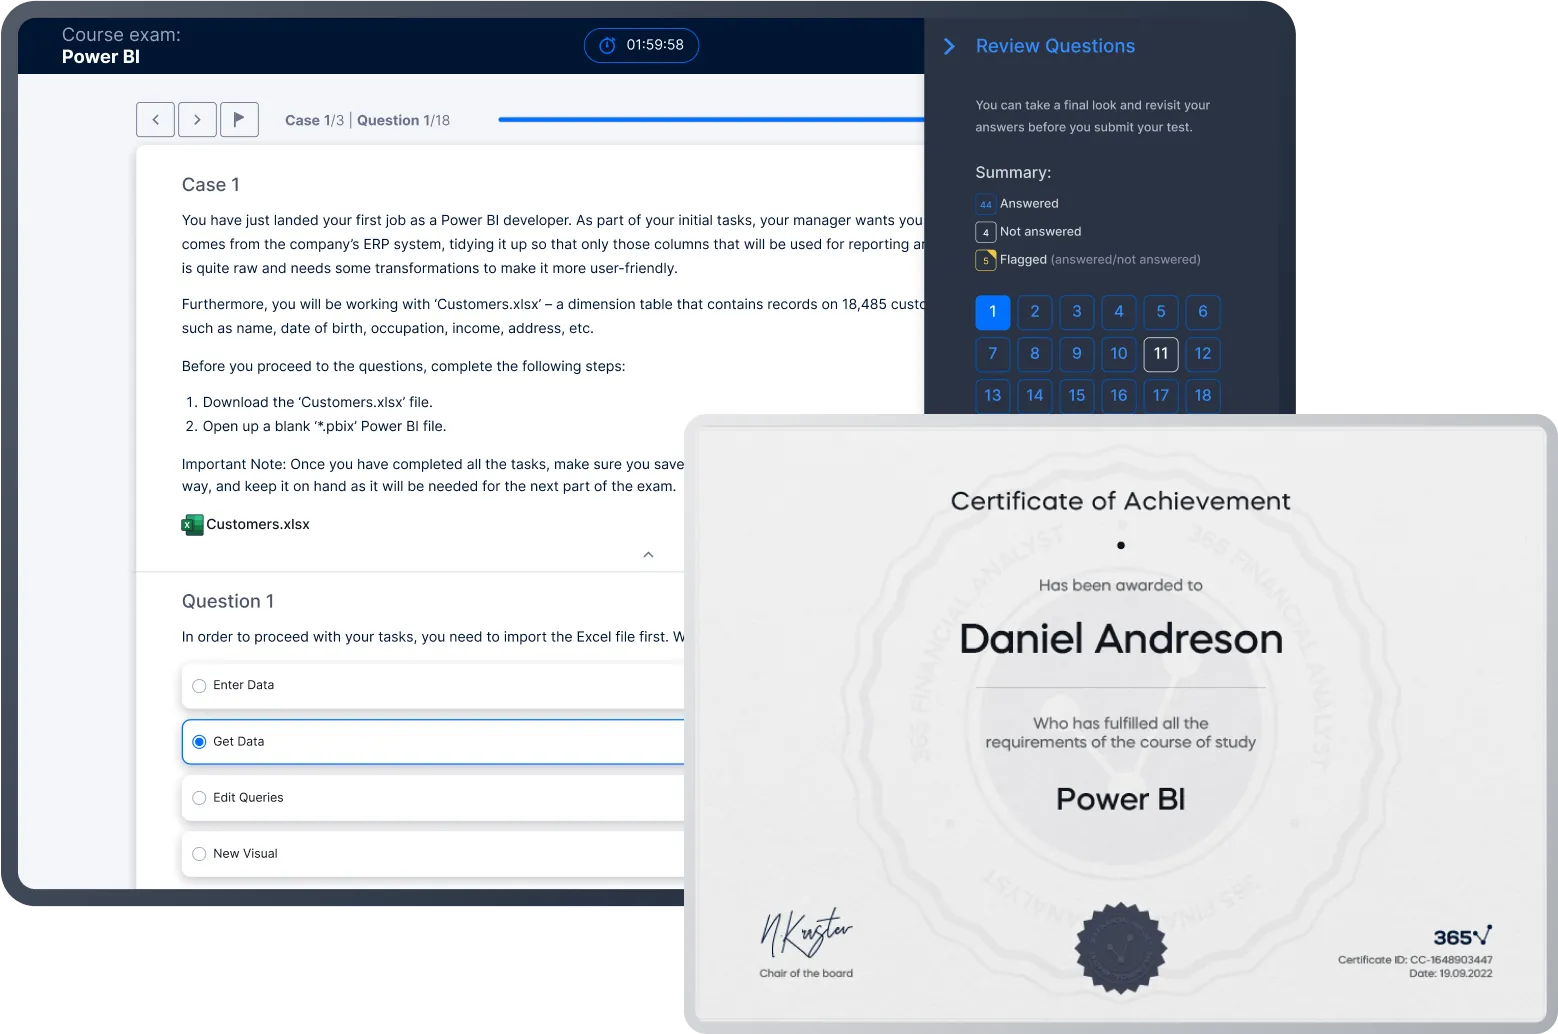
- Course exam
- Certificate of achievement
Technical Analysis
Start for free
What you get:
- 1 hour of content
- 14 Interactive exercises
- World-class instructor
- Closed captions
- Q&A support
- Future course updates
- Course exam
- Certificate of achievement
Start for free
What you get:
- 1 hour of content
- 14 Interactive exercises
- World-class instructor
- Closed captions
- Q&A support
- Future course updates
- Course exam
- Certificate of achievement
What you learn
- Understand core principles and assumptions of technical analysis
- Interpret chart patterns using psychology and behavioral finance
- Build strategies with indicators to follow and profit from trends
- Explore links between bonds, stocks, FX, and commodities with TA
- Explore common technical analysis indicators and their practical application
- Apply market cycles to improve timing and trading performance
Top Choice of Leading Companies Worldwide
Industry leaders and professionals globally rely on this top-rated course to enhance their skills.
Course Description
Learn for Free

1.1 Course Introduction
2 min
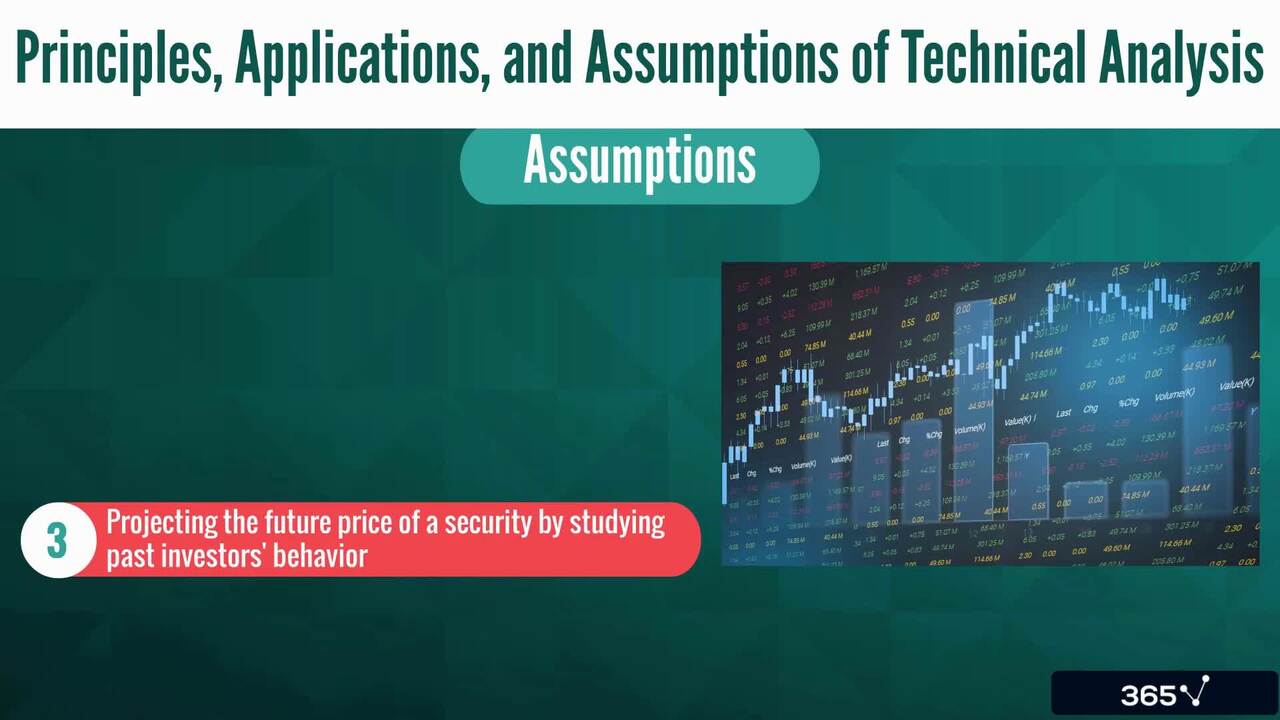
1.2 Technical Analysis - Principles, Applications, Assumptions
3 min
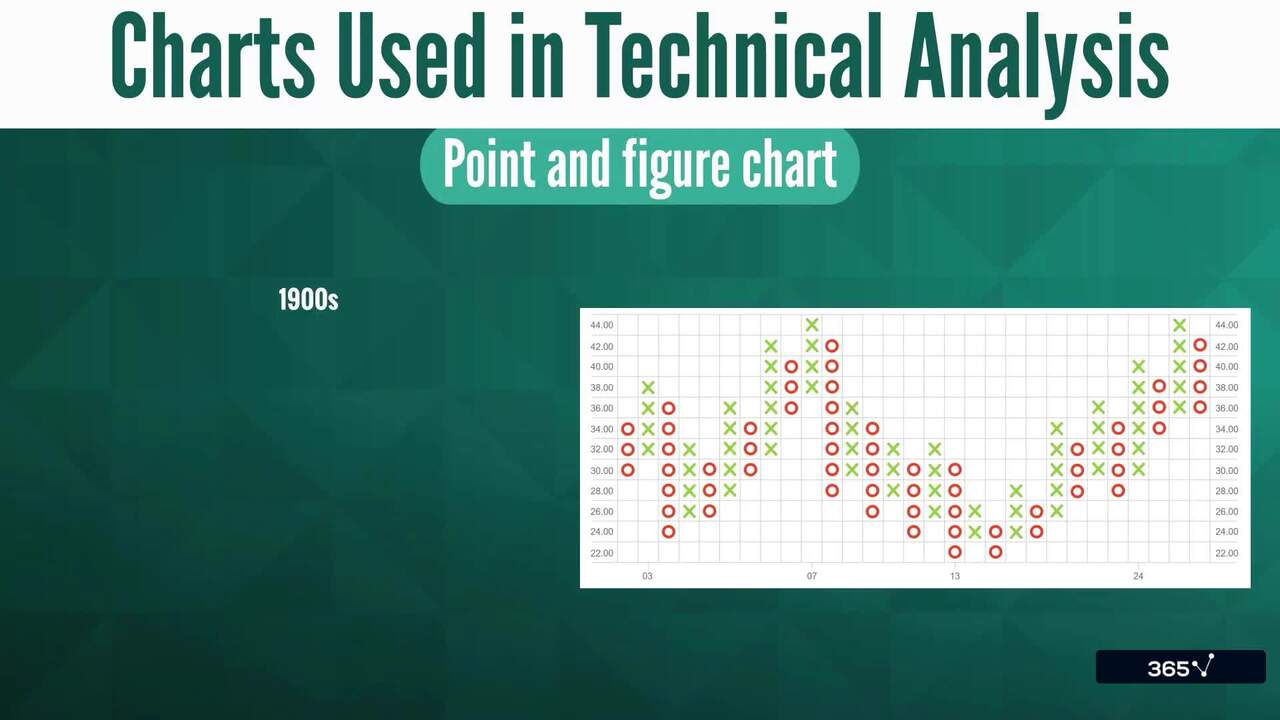
1.3 Charts Used in Technical Analysis
6 min
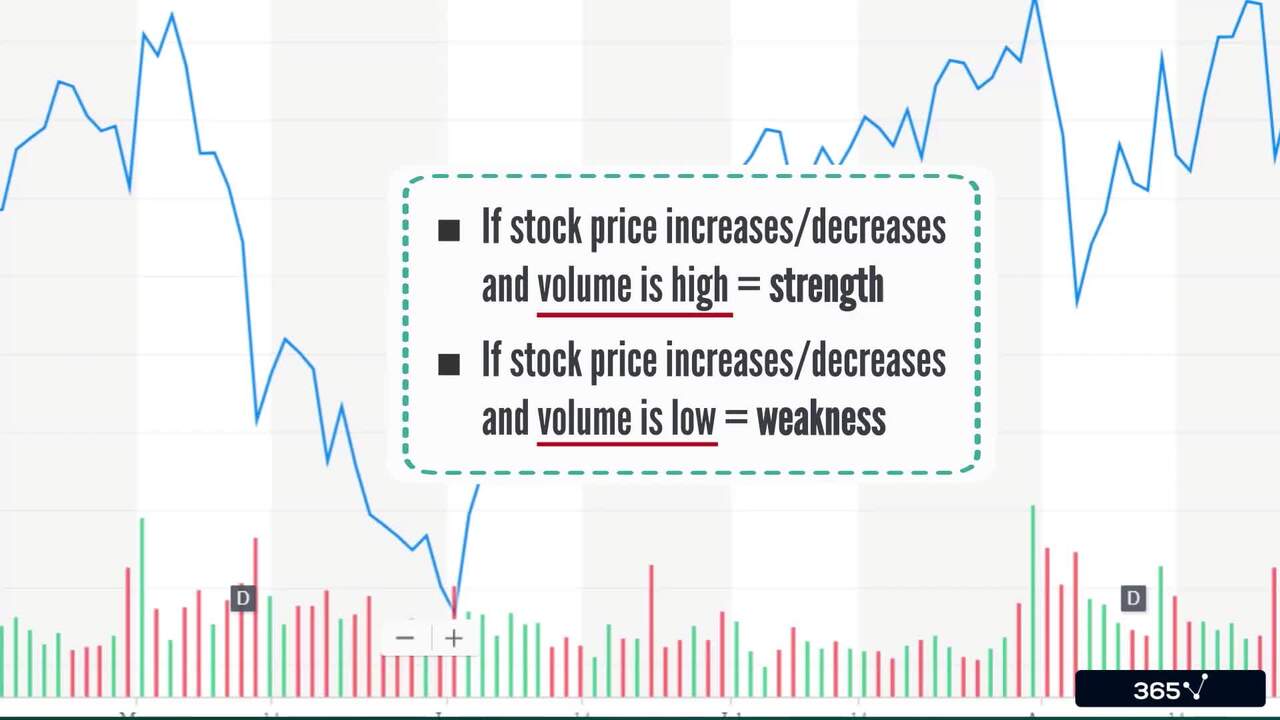
1.4 Other Tools Used in Technical Analysis
2 min
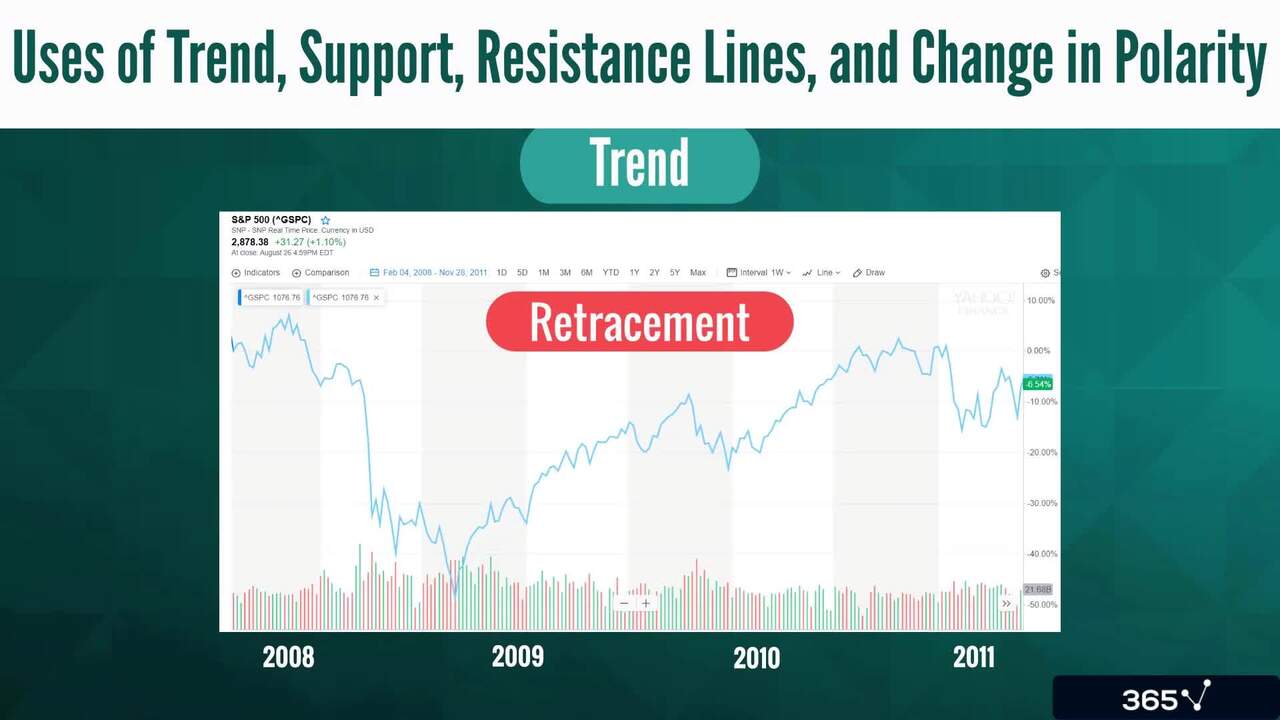
1.6 Trend, Support and Resistance Lines
4 min
1.7 Common Chart Patterns
4 min
Curriculum
Topics
Course Requirements
- No prior experience or knowledge is required. We will start from the basics and gradually build your understanding. Everything you need is included in the course
Who Should Take This Course?
Level of difficulty: Intermediate
- Aspiring traders
- Everyone who wants to invest funds in public markets and understand short-term performance
Exams and Certification
A 365 Financial Analyst Course Certificate is an excellent addition to your LinkedIn profile—demonstrating your expertise and willingness to go the extra mile to accomplish your goals.
Meet Your Instructor


Ivan Kitov is the COO of 365 Data Science and a CFA charterholder with over 12 years in finance. He holds a Master's in Financial Economics from Erasmus University Rotterdam and combines expertise in corporate finance, investments, and strategy with a passion for AI and machine learning. Since 2019, he has created courses that have helped thousands of students worldwide gain practical finance and data skills, with the goal of making 365 Data Science the top global platform for aspiring professionals.
What Our Learners Say


365 Financial Analyst Is Featured at
Our top-rated courses are trusted by business worldwide.