Statistics
Start your data analysis journey by laying a solid foundation: learn statistics and harness the power of data-driven decision-making
 Start for free
What you get:
- 5 hours of content
- 96 Interactive exercises
- 78 Downloadable resources
- World-class instructor
- Closed captions
- Q&A support
- Future course updates
- Course exam
- Certificate of achievement
Statistics
Start for free
What you get:
- 5 hours of content
- 96 Interactive exercises
- 78 Downloadable resources
- World-class instructor
- Closed captions
- Q&A support
- Future course updates
- Course exam
- Certificate of achievement
Start for free
What you get:
- 5 hours of content
- 96 Interactive exercises
- 78 Downloadable resources
- World-class instructor
- Closed captions
- Q&A support
- Future course updates
- Course exam
- Certificate of achievement
What you learn
- Understand the fundamentals of statistics.
- Gain strong quantitative skills that will help you master advanced concepts.
- Distinguish between the diverse data types and levels of measurement.
- Calculate confidence intervals to make informed decisions.
- Use hypothesis testing to answer business questions.
Top Choice of Leading Companies Worldwide
Industry leaders and professionals globally rely on this top-rated course to enhance their skills.
Course Description
Learn for Free
1.1 What does the course cover
3 min
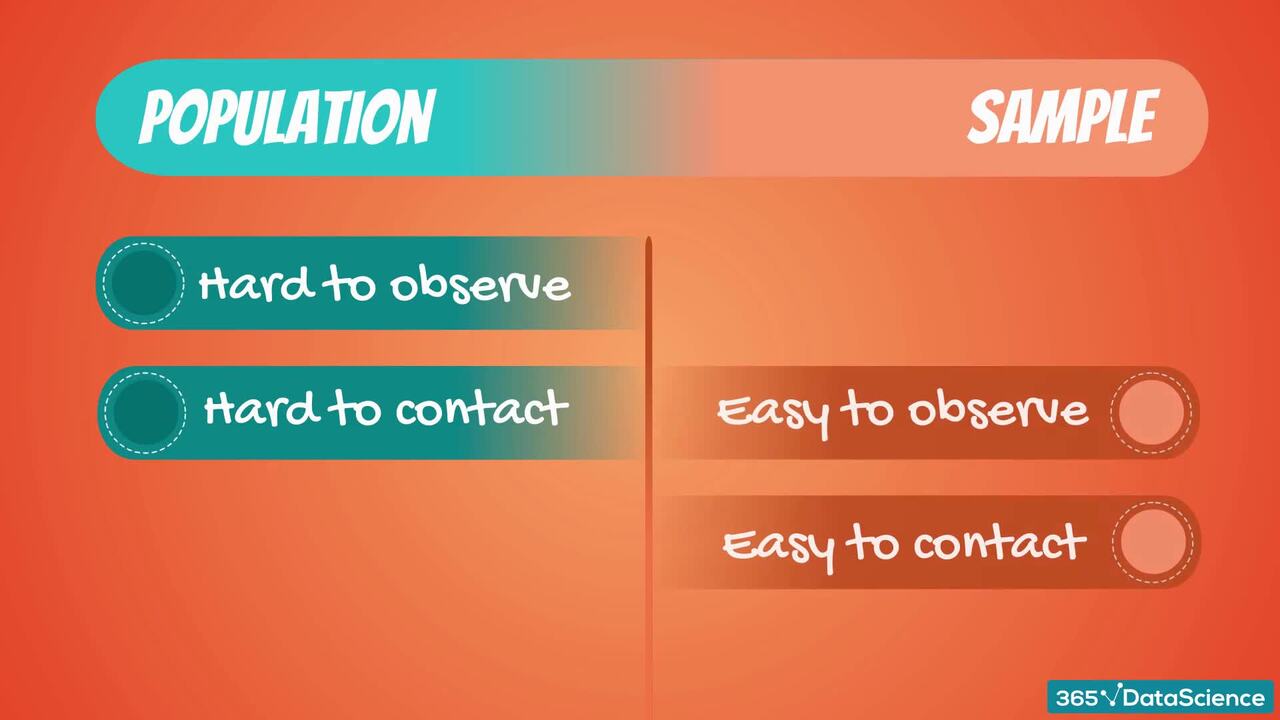
1.2 Population vs sample
4 min
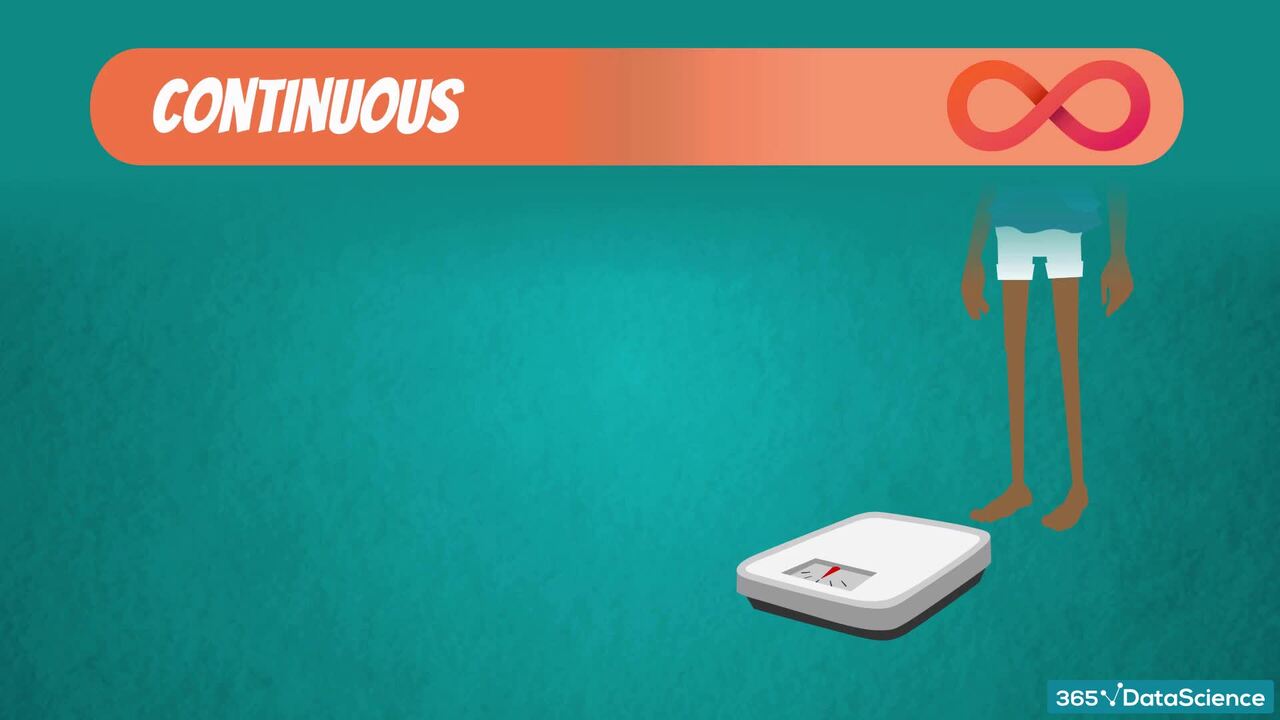
2.1 Types of data and levels of measurement
5 min
2.2 Levels of measurement
4 min
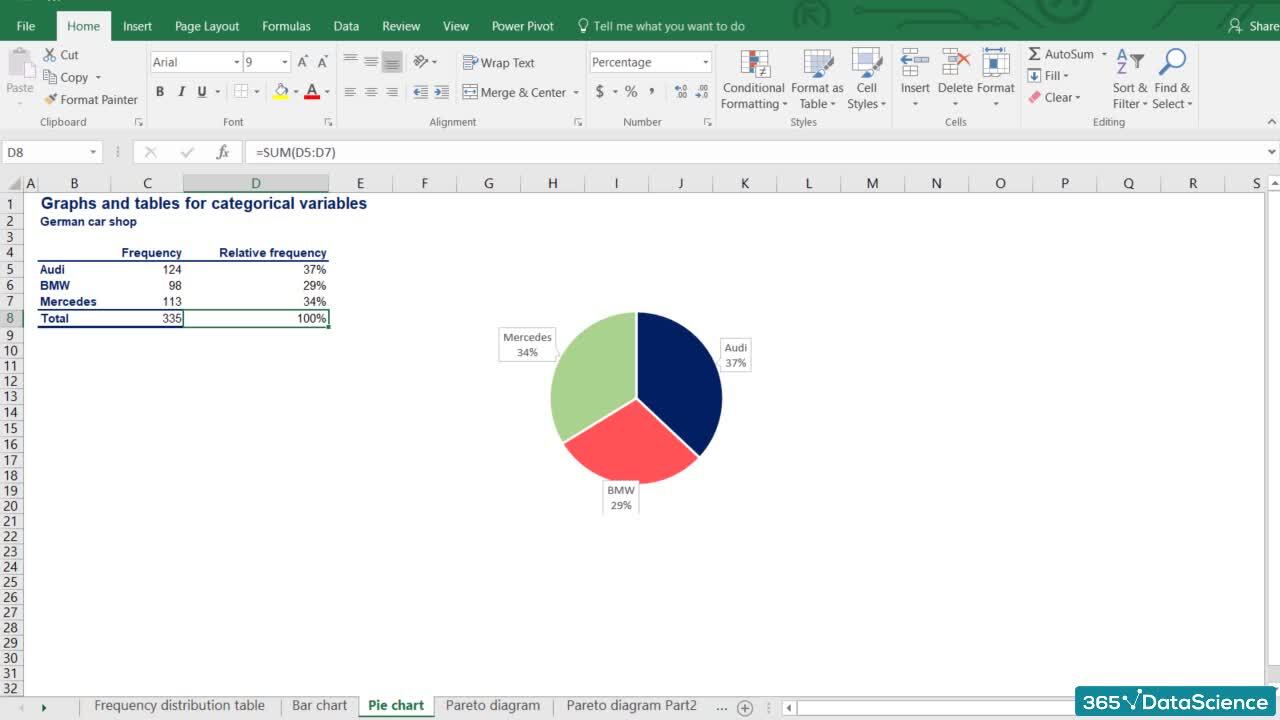
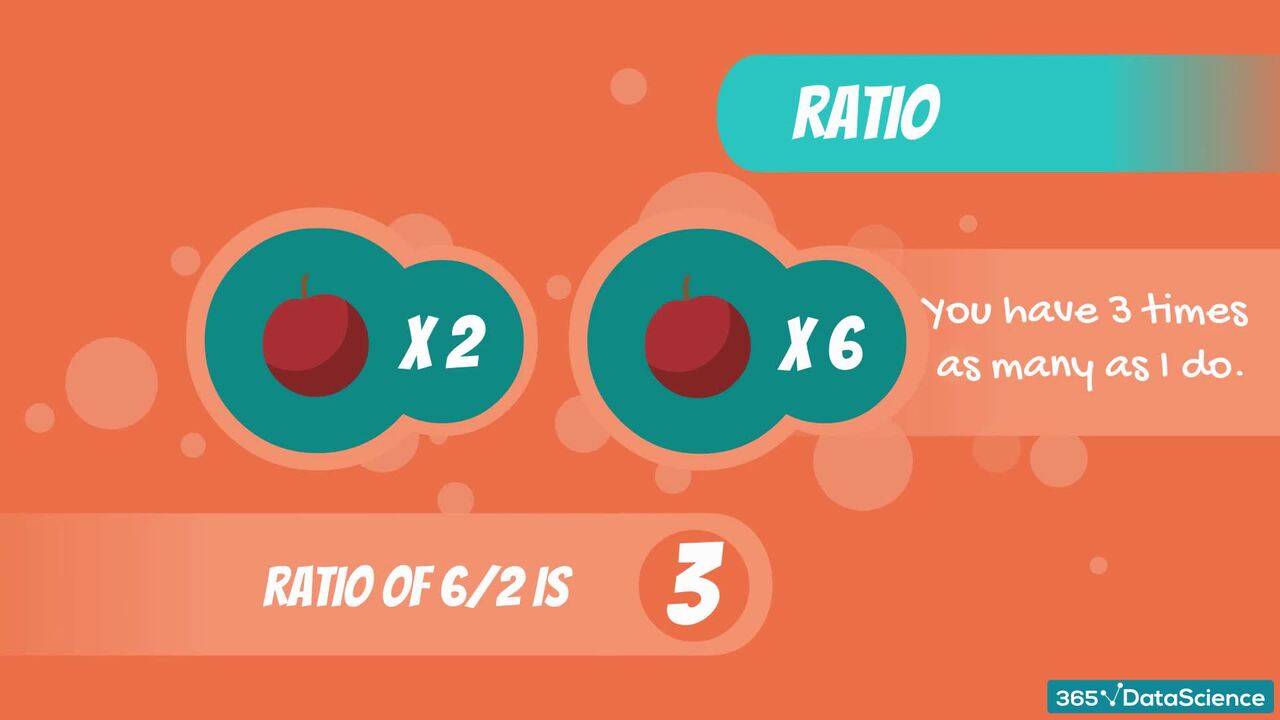
2.4 Categorical Variables. Visualization techniques
5 min
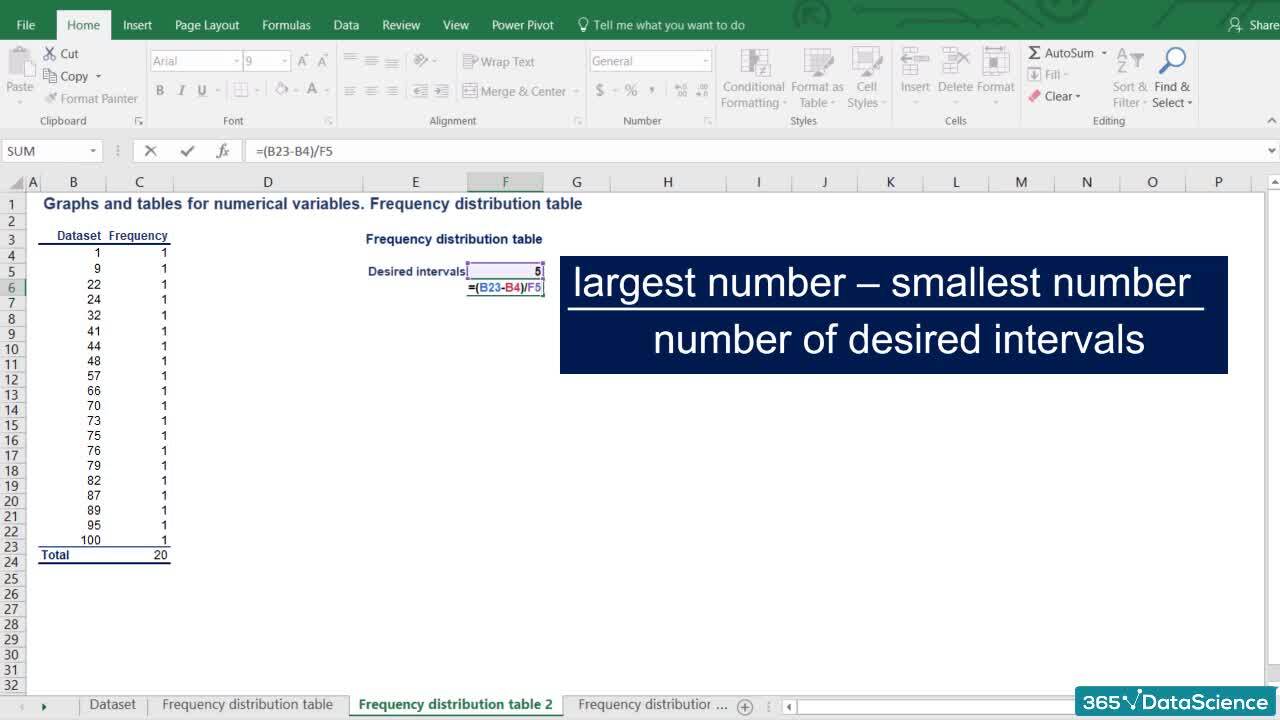
2.5 Numerical Variables. Frequency distribution table
3 min
Curriculum
- 2. Descriptive Statistics Fundamentals13 Lessons 64 MinHere, you will learn how to distinguish between the different types of data and levels of measurement. This will help you when calculating the measures of central tendency (mean, median, and mode) and dispersion indicators such as variance and standard deviation, as well as measures of the relationship between variables like covariance and correlation. To reinforce what you have learned, we will wrap up this section with a hands-on practical example.Types of data and levels of measurement5 minLevels of measurement4 minCategorical Variables. Visualization techniques5 minNumerical Variables. Frequency distribution table3 minThe histogram2 minCross table and scatter plot5 minMean, median, mode4 minSkewness3 minVariance6 minStandard deviation and coefficient of variation5 minCovariance3 minCorrelation3 minPractical Example - Descriptive Statistics16 min
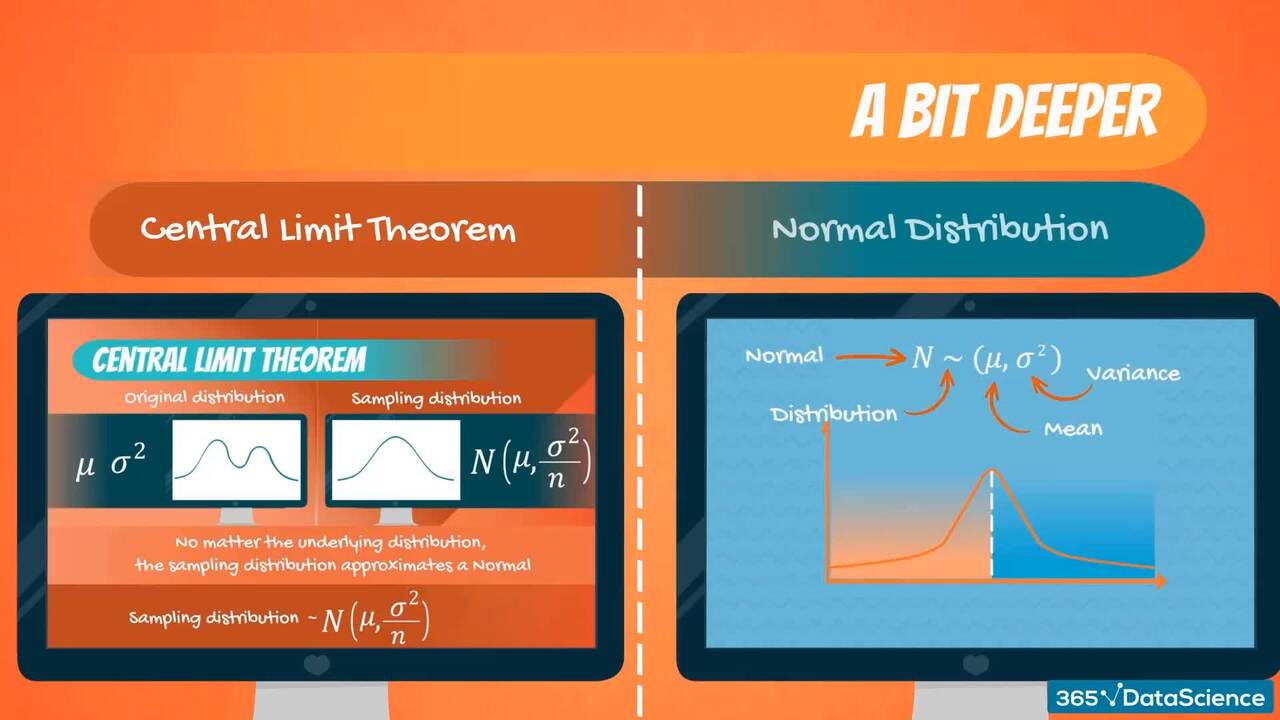
- 3. Inferential Statistics Fundamentals7 Lessons 22 MinIn this section, you will learn what a distribution is and what characterizes the normal distribution. We will introduce you to the central limit theorem and to the concept of standard error.Introduction1 minWhat is a distribution5 minThe Normal Distribution4 minThe Standard Normal Distribution4 minCentral limit theorem4 minStandard error1 minEstimators and estimates3 min
- 4. Confidence Intervals11 Lessons 55 MinHere, you will learn how to calculate confidence intervals with known population and variance. We will introduce the Student T distribution, and you will learn how to work with smaller samples, as well as differences between two means (with dependent and independent samples). These tools are fundamental later on when we start applying each of these concepts to large datasets and use coding languages like Python and R. To reinforce what you have learned, we will wrap up this section with an easy-to-understand practical example.Definition of confidence intervals3 minPopulation variance known, z-score8 minConfidence Interval Clarifications5 minStudent's T Distribution3 minPopulation variance unknown, t-score5 minMargin of error5 minConfidence intervals. Two means. Dependent samples6 minConfidence intervals. Two means. Independent samples (Part1)5 minConfidence intervals. Two means. Independent samples (Part2)4 minConfidence intervals. Two means. Independent Samples (Part 3)1 minPractical Example - Confidence Intervals10 min
- 5. Hypothesis testing11 Lessons 55 MinIn this section, you will learn how to perform hypothesis testing, as well as the difference between a null and alternative hypothesis. We will discuss rejection and significance levels, and type I and type II errors. The lessons will teach you how to test for the mean when the population variance is known and unknown, as well as how to test for the mean when you are dealing with dependent and independent samples. You will also become familiar with the p-value. To consolidate the new knowledge, we will conclude with a practical example.Null vs Alternative6 minFurther Reading on Null and Alternative Hypothesis Read now2 minRejection region and significance level7 minType I error vs type II error4 minTest for the mean. Population variance known7 minp-value4 minTest for the mean. Population variance unknown5 minTest for the mean. Dependent samples5 minTest for the mean. Independent Samples (Part 1)4 minTest for the mean. Independent Samples (Part 2)4 minPractical Example - Hypothesis Testing7 min
Topics
Course Requirements
- Microsoft Excel (any recent version, such as Excel 2019, 2021, or Microsoft 365)
- No prior knowledge of statistics is required.
Who Should Take This Course?
Level of difficulty: Beginner
- People who want to improve their quantitative skills
- Aspiring data analysts, data scientists, business analysts
- Graduate students who need statistics for their studies
- Business executives who are passionate about data-driven decision-making
Exams and Certification
A 365 Financial Analyst Course Certificate is an excellent addition to your LinkedIn profile—demonstrating your expertise and willingness to go the extra mile to accomplish your goals.
Meet Your Instructor


Iliya Valchanov is a serial entrepreneur, AI educator, and co-founder of 365 Data Science and 3veta. He is also the CEO of Team-GPT, an enterprise AI platform helping organizations harness the power of large language models. A finance graduate from Bocconi University and a former mathematics competition champion, Iliya has built a career at the intersection of data science, technology, and business innovation. His expertise spans mathematics, statistics, machine learning, deep learning, and entrepreneurship, and his work has helped individuals and companies around the world leverage data and AI for measurable results. Today, he continues to combine education and innovation, leading cutting-edge AI initiatives used by organizations across industries.
What Our Learners Say


365 Financial Analyst Is Featured at
Our top-rated courses are trusted by business worldwide.