Introduction to Tableau
Start your Tableau journey and learn how to create professional data visualizations in Tableau
 Start for free
What you get:
- 2 hours of content
- 8 Interactive exercises
- 31 Downloadable resources
- World-class instructor
- Closed captions
- Q&A support
- Future course updates
- Course exam
- Certificate of achievement
Introduction to Tableau
Start for free
What you get:
- 2 hours of content
- 8 Interactive exercises
- 31 Downloadable resources
- World-class instructor
- Closed captions
- Q&A support
- Future course updates
- Course exam
- Certificate of achievement
Start for free
What you get:
- 2 hours of content
- 8 Interactive exercises
- 31 Downloadable resources
- World-class instructor
- Closed captions
- Q&A support
- Future course updates
- Course exam
- Certificate of achievement
What you learn
- Learn Tableau fundamentals, interface, and key features.
- Create data visualizations using a professional BI tool.
- Use joins, data blending, calculations, filters, charts, and dashboards.
- Create professional Tableau dashboards.
- Apply your skills in a real-world Tableau dashboard task.
Top Choice of Leading Companies Worldwide
Industry leaders and professionals globally rely on this top-rated course to enhance their skills.
Course Description
Learn for Free

1.1 Welcome to Tableau
1 min
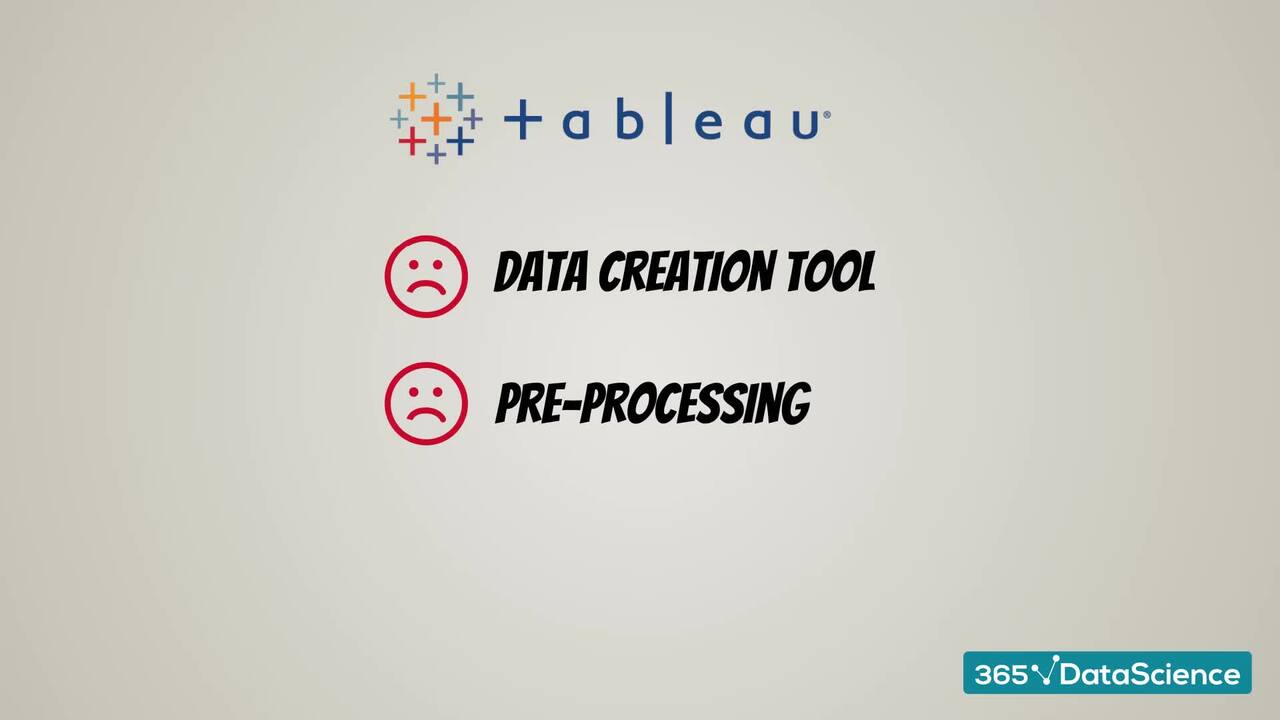
1.2 Why use Tableau: Make your data make an impact
4 min
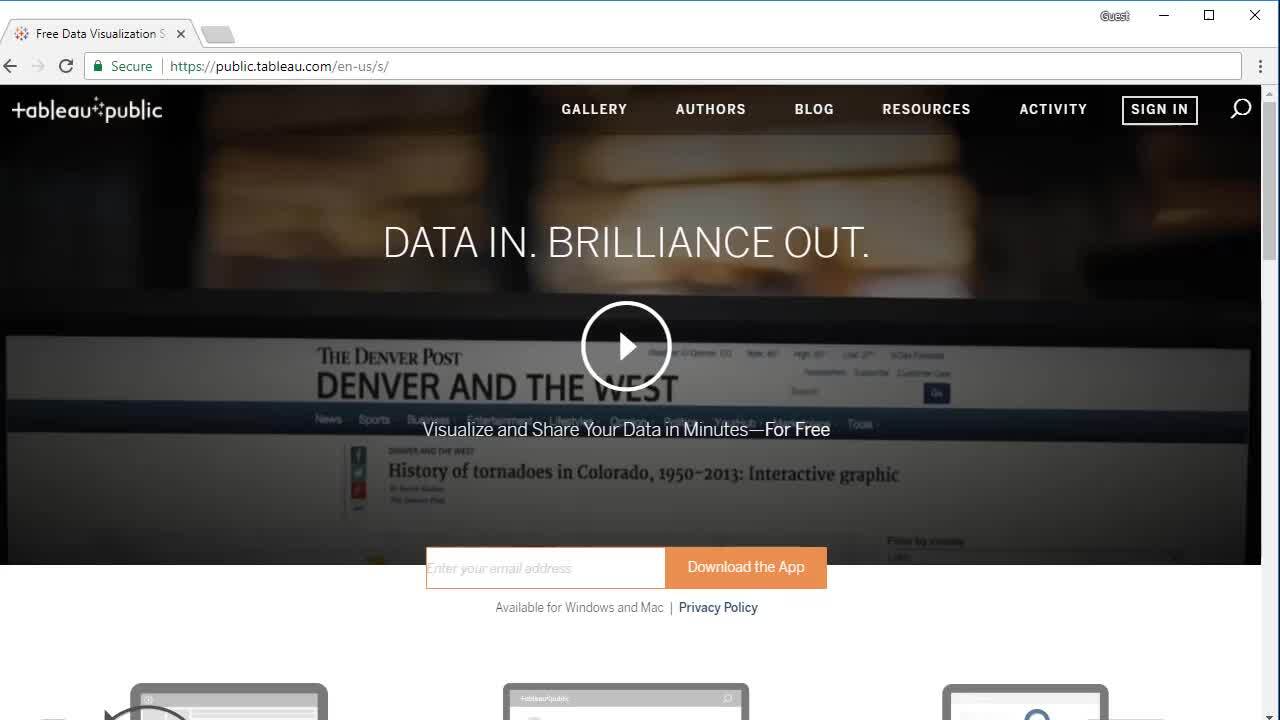
1.4 Let's download Tableau Public
2 min
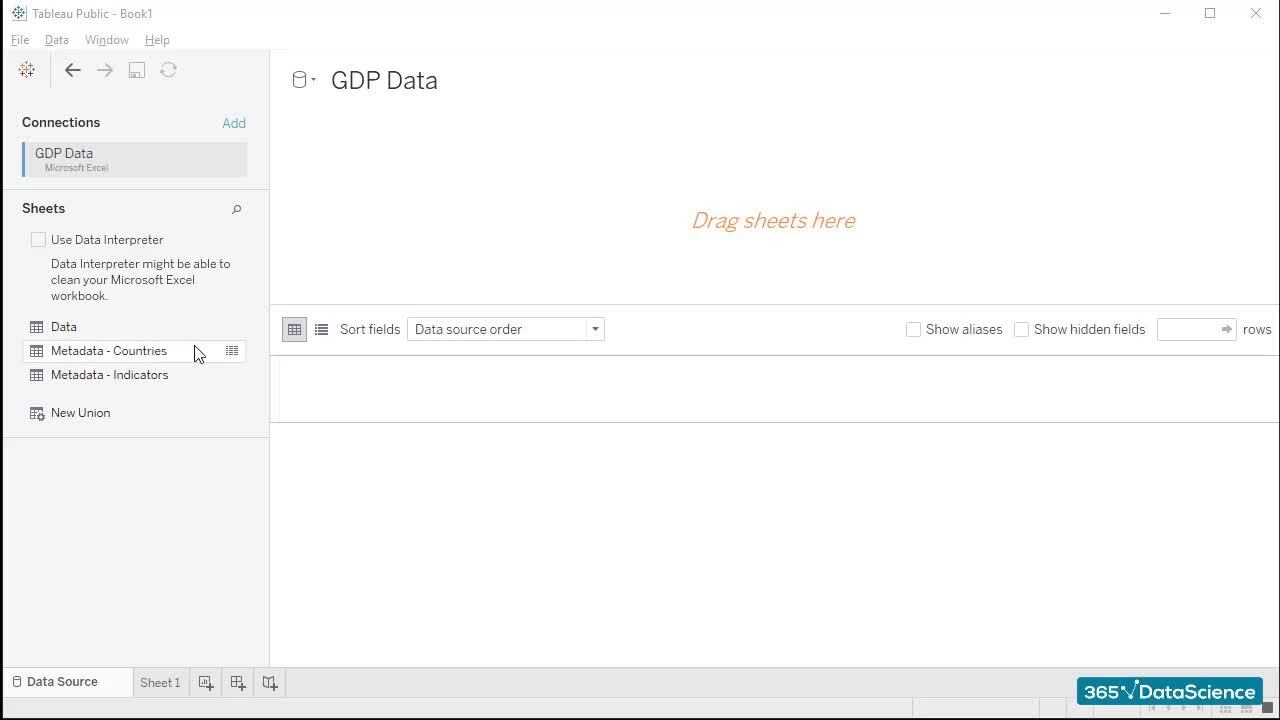
1.5 Connecting data in Tableau
2 min
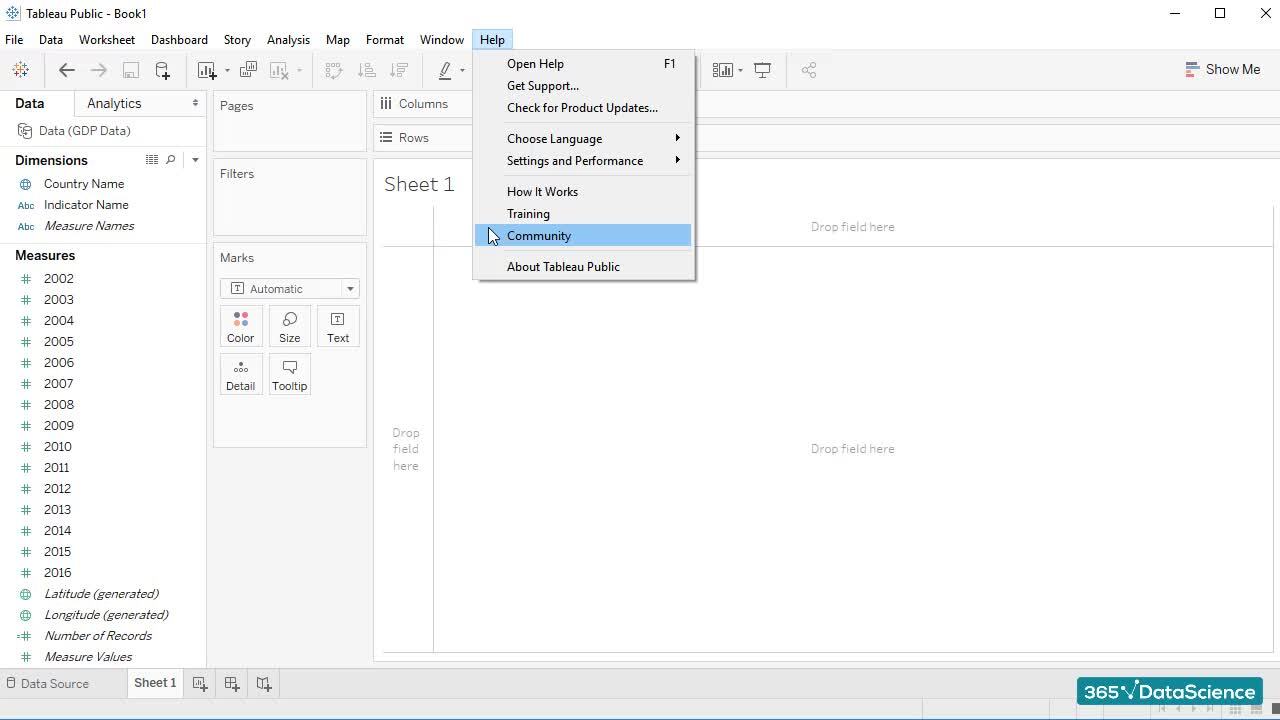
1.6 Exploring Tableau's interface
9 min
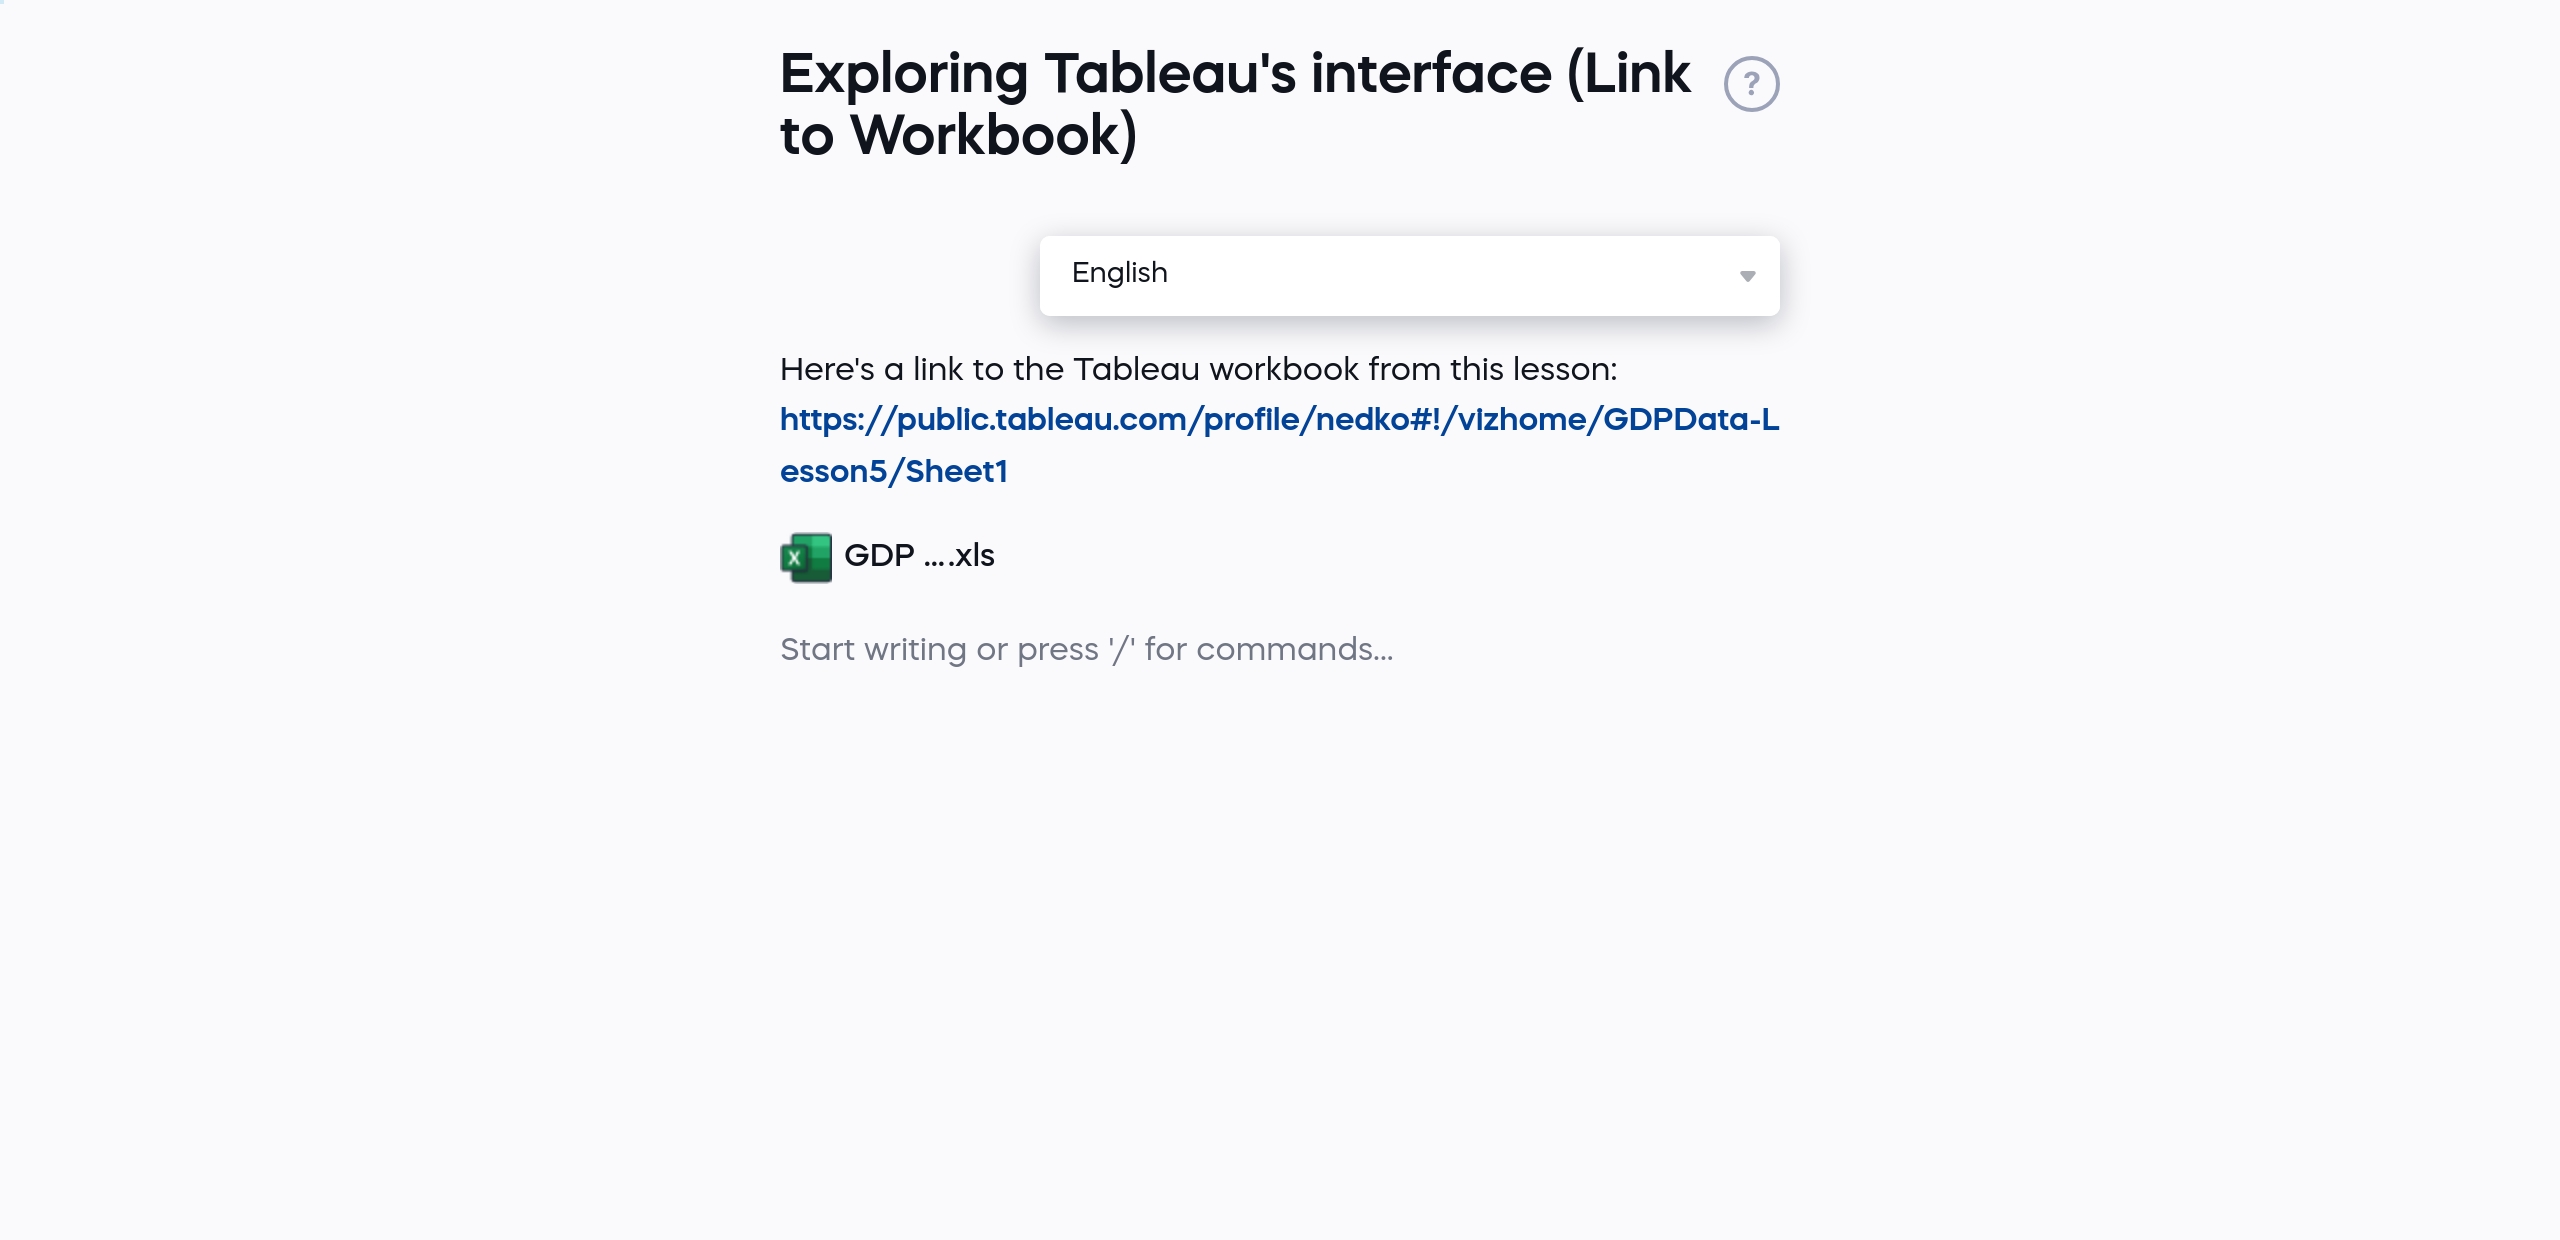
1.7 Exploring Tableau's interface (Link to Workbook)
1 min
Curriculum
- 2. Tableau Functionalities12 Lessons 28 MinIn this section, you will create your first Tableau charts and tables. We will teach you how to create basic charts and adjust parts of their appearance. By the end of this section, you will be able to use many of Tableau's core functionalities, like creating custom fields, adding calculations to a table, adding totals and subtotals, and adding a filter.Creating a table5 minCreating a table - link Read now1 minCreating custom fields2 minCreating a custom field and adding calculations to a table4 minCreating a custom field and adding calculations to a table - link Read now1 minAdding totals and subtotals2 minAdding totals and subtotals - link Read now1 minAdding a custom calculation3 minAdding a custom calculation - link Read now1 minInserting a filter2 minInserting a filter - link Read now1 minWorking with joins in Tableau5 min
- 3. The Tableau Exercise20 Lessons 52 MinThis section is a practical example that will help you apply your skills in practice with real data. The exercise is divided into two parts. In the first part, we will test several ways to connect our data. You already studied joins in SQL. Here, you will see how to apply joins in a Tableau context. You will also learn about data blending, and current best practices. By the end of the exercise, you will create three charts. Each of these charts analyzes a different aspect of a real-life dataset. We will group the charts in a dashboard and add a filter, applying it to all three charts at the same time.Introduction to the exercise2 minLet's create a dashboard - Visualizing the three charts we want to create2 minUsing Joins in Tableau6 minPerforming a Numbers Check - Attempt #14 minPerforming a Numbers Check - Attempt #1 - link Read now1 minBlending Data in Tableau6 minBlending Data in Tableau - link Read now1 minPerforming a Numbers Check - Attempt #24 minPerforming a Numbers Check - Attempt #2 - link Read now1 minFirst chart4 minFirst chart - link Read now1 minSecond chart3 minSecond chart - link Read now1 minThird Chart3 minThird Chart - link Read now1 minCreating and Formatting a Dashboard4 minCreating and Formatting a Dashboard - link Read now1 minAdding Interactive Filters for Improved Analysis4 minAdding Interactive Filters for Improved Analysis - link Read now1 minInteractive filters - fix2 min
Topics
Course Requirements
- Tableau Desktop or Tableau Public
Who Should Take This Course?
Level of difficulty: Beginner
- Tableau beginners
- Aspiring analysts and people who want a career in Business Intelligence
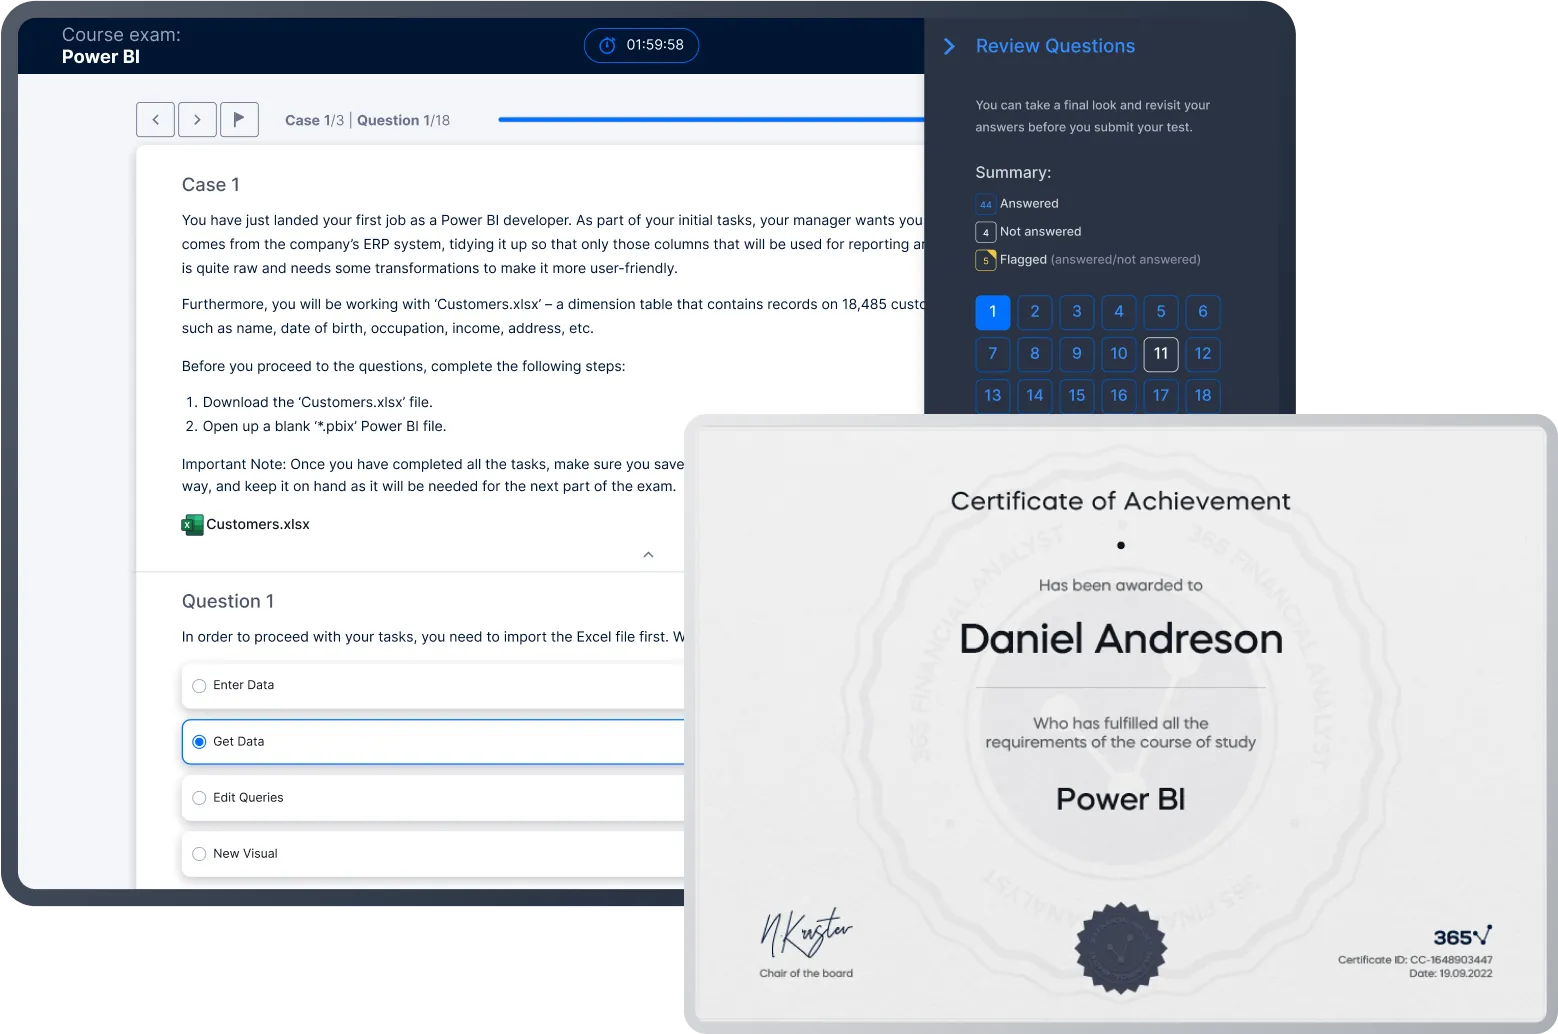
Exams and Certification
A 365 Financial Analyst Course Certificate is an excellent addition to your LinkedIn profile—demonstrating your expertise and willingness to go the extra mile to accomplish your goals.
Meet Your Instructor


Ned Krastev is an entrepreneur and educator who has helped over 1.6 million students worldwide gain business, finance, and data skills. After earning his Master's degree in Finance from Bocconi University in Milan, he built a career with leading companies including PwC Italy, Coca-Cola European Partners, and Infineon Technologies. In 2014, Ned published his first online course on financial modeling and valuation, sparking his passion for online education. Today, as Founder & CEO of 365 Careers and Co-founder of 365 Data Science, he leads one of the most successful global providers of professional training, aiming to bridge the gap between academic theory and real-world business application.
What Our Learners Say


365 Financial Analyst Is Featured at
Our top-rated courses are trusted by business worldwide.