Econometrics I
Learn Econometrics the Practical Way – Hands-On Python Skills for Real-World Data Analysis and Modeling
 Start for free
What you get:
- 2 hours of content
- 5 Interactive exercises
- 8 Coding exercises
- 30 Downloadable resources
- World-class instructor
- Closed captions
- Q&A support
- Future course updates
- Course exam
- Certificate of achievement
Econometrics I
Start for free
What you get:
- 2 hours of content
- 5 Interactive exercises
- 8 Coding exercises
- 30 Downloadable resources
- World-class instructor
- Closed captions
- Q&A support
- Future course updates
- Course exam
- Certificate of achievement
Start for free
What you get:
- 2 hours of content
- 5 Interactive exercises
- 8 Coding exercises
- 30 Downloadable resources
- World-class instructor
- Closed captions
- Q&A support
- Future course updates
- Course exam
- Certificate of achievement

What you learn
- Master Python for econometric analysis using pandas.
- Master data wrangling, including importing, merging, and transformations.
- Conduct descriptive analysis with a focus on outlier detection.
- Perform regression analysis and test for violations of model assumptions.
- Apply panel data and binary choice models with correct model specification.
Top Choice of Leading Companies Worldwide
Industry leaders and professionals globally rely on this top-rated course to enhance their skills.
Course Description
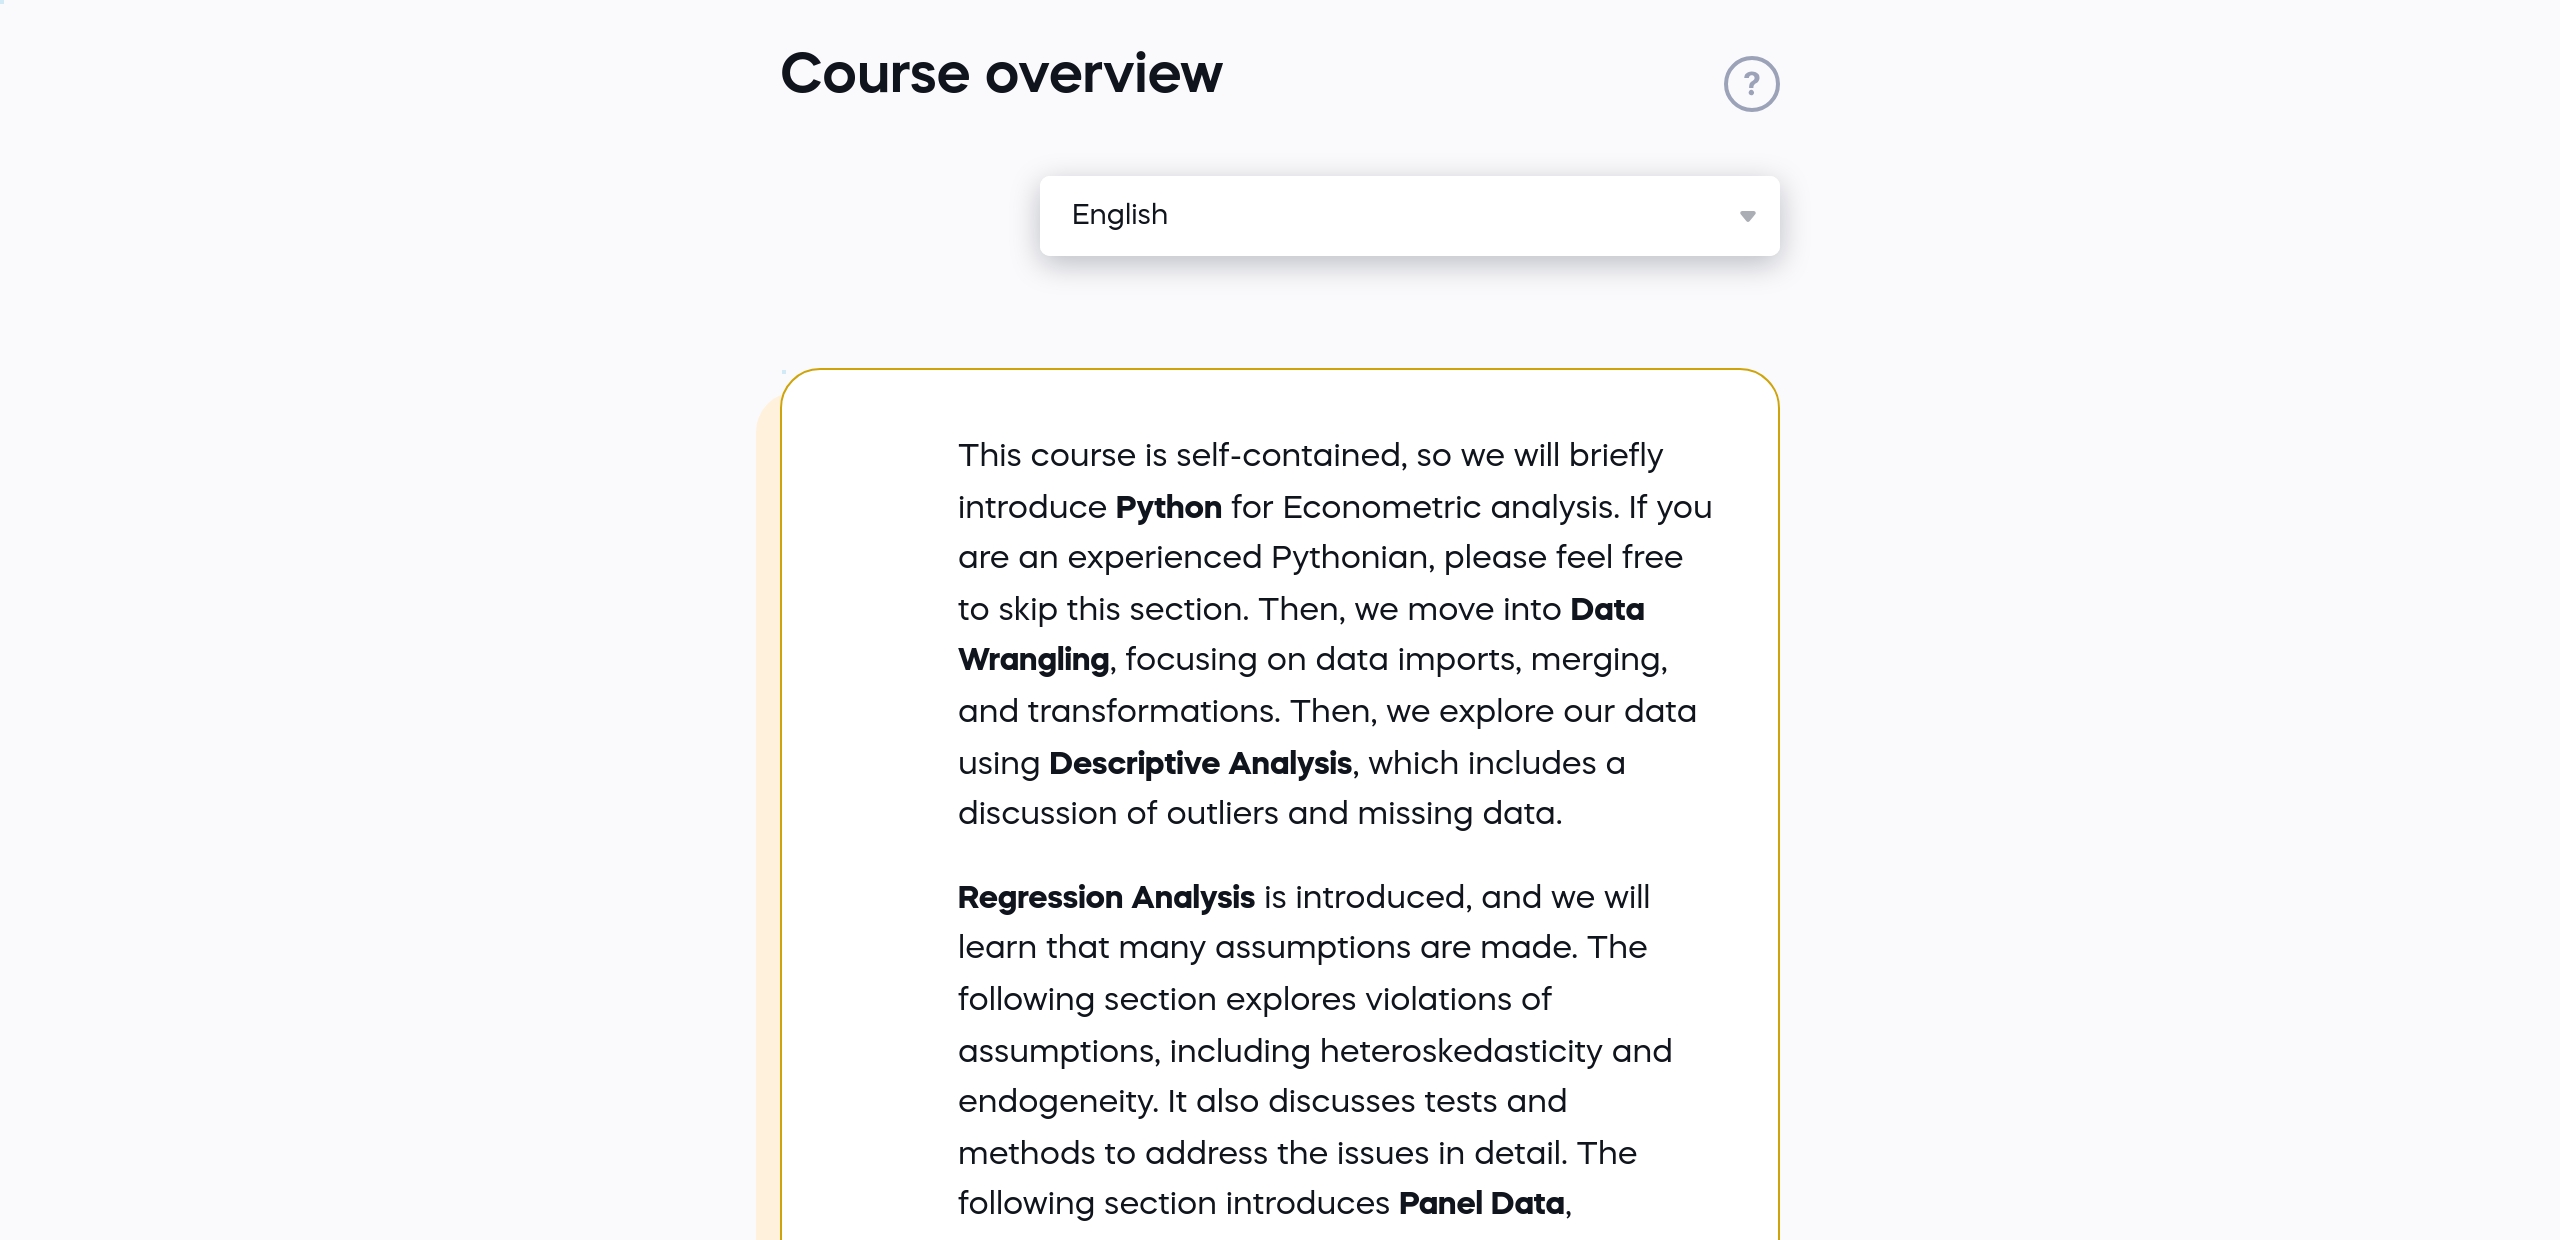
The introduction provides a concise overview of the course's aims and scope. The course is self-contained, including a brief introduction to Python with a focus on Pandas. Then we move into Data Wrangling, focusing on data imports, merging and transformations. Then, we explore our data using Descriptive Analysis. Section 5 introduces Regression Analysis. We will learn that many assumptions are made in the process of regression analysis. Section 6 explores violations of assumptions, including Heteroskedasticity and endogeneity. Tests and methods to address the issues are discussed in detail. Section 7 introduces panel data models, including fixed and random effects. Then, we move on to binary choice models, i.e., explaining yes-or-no events or decisions. We conclude with a section on model specification and parameter stability.
After completing this course, you will be able to use Python for Econometric Analysis with confidence. You will develop a solid understanding of applied Econometrics, including data wrangling, outlier detection, and regression analysis.
This course will be more than sufficient for most applied work. I promise that it is highly applied and provides hands-on experience with numerous practical applications. Enjoy the Joy of Econometrics!
Learn for Free
1.1 Getting started
1 min
1.2 Your instructor
1 min
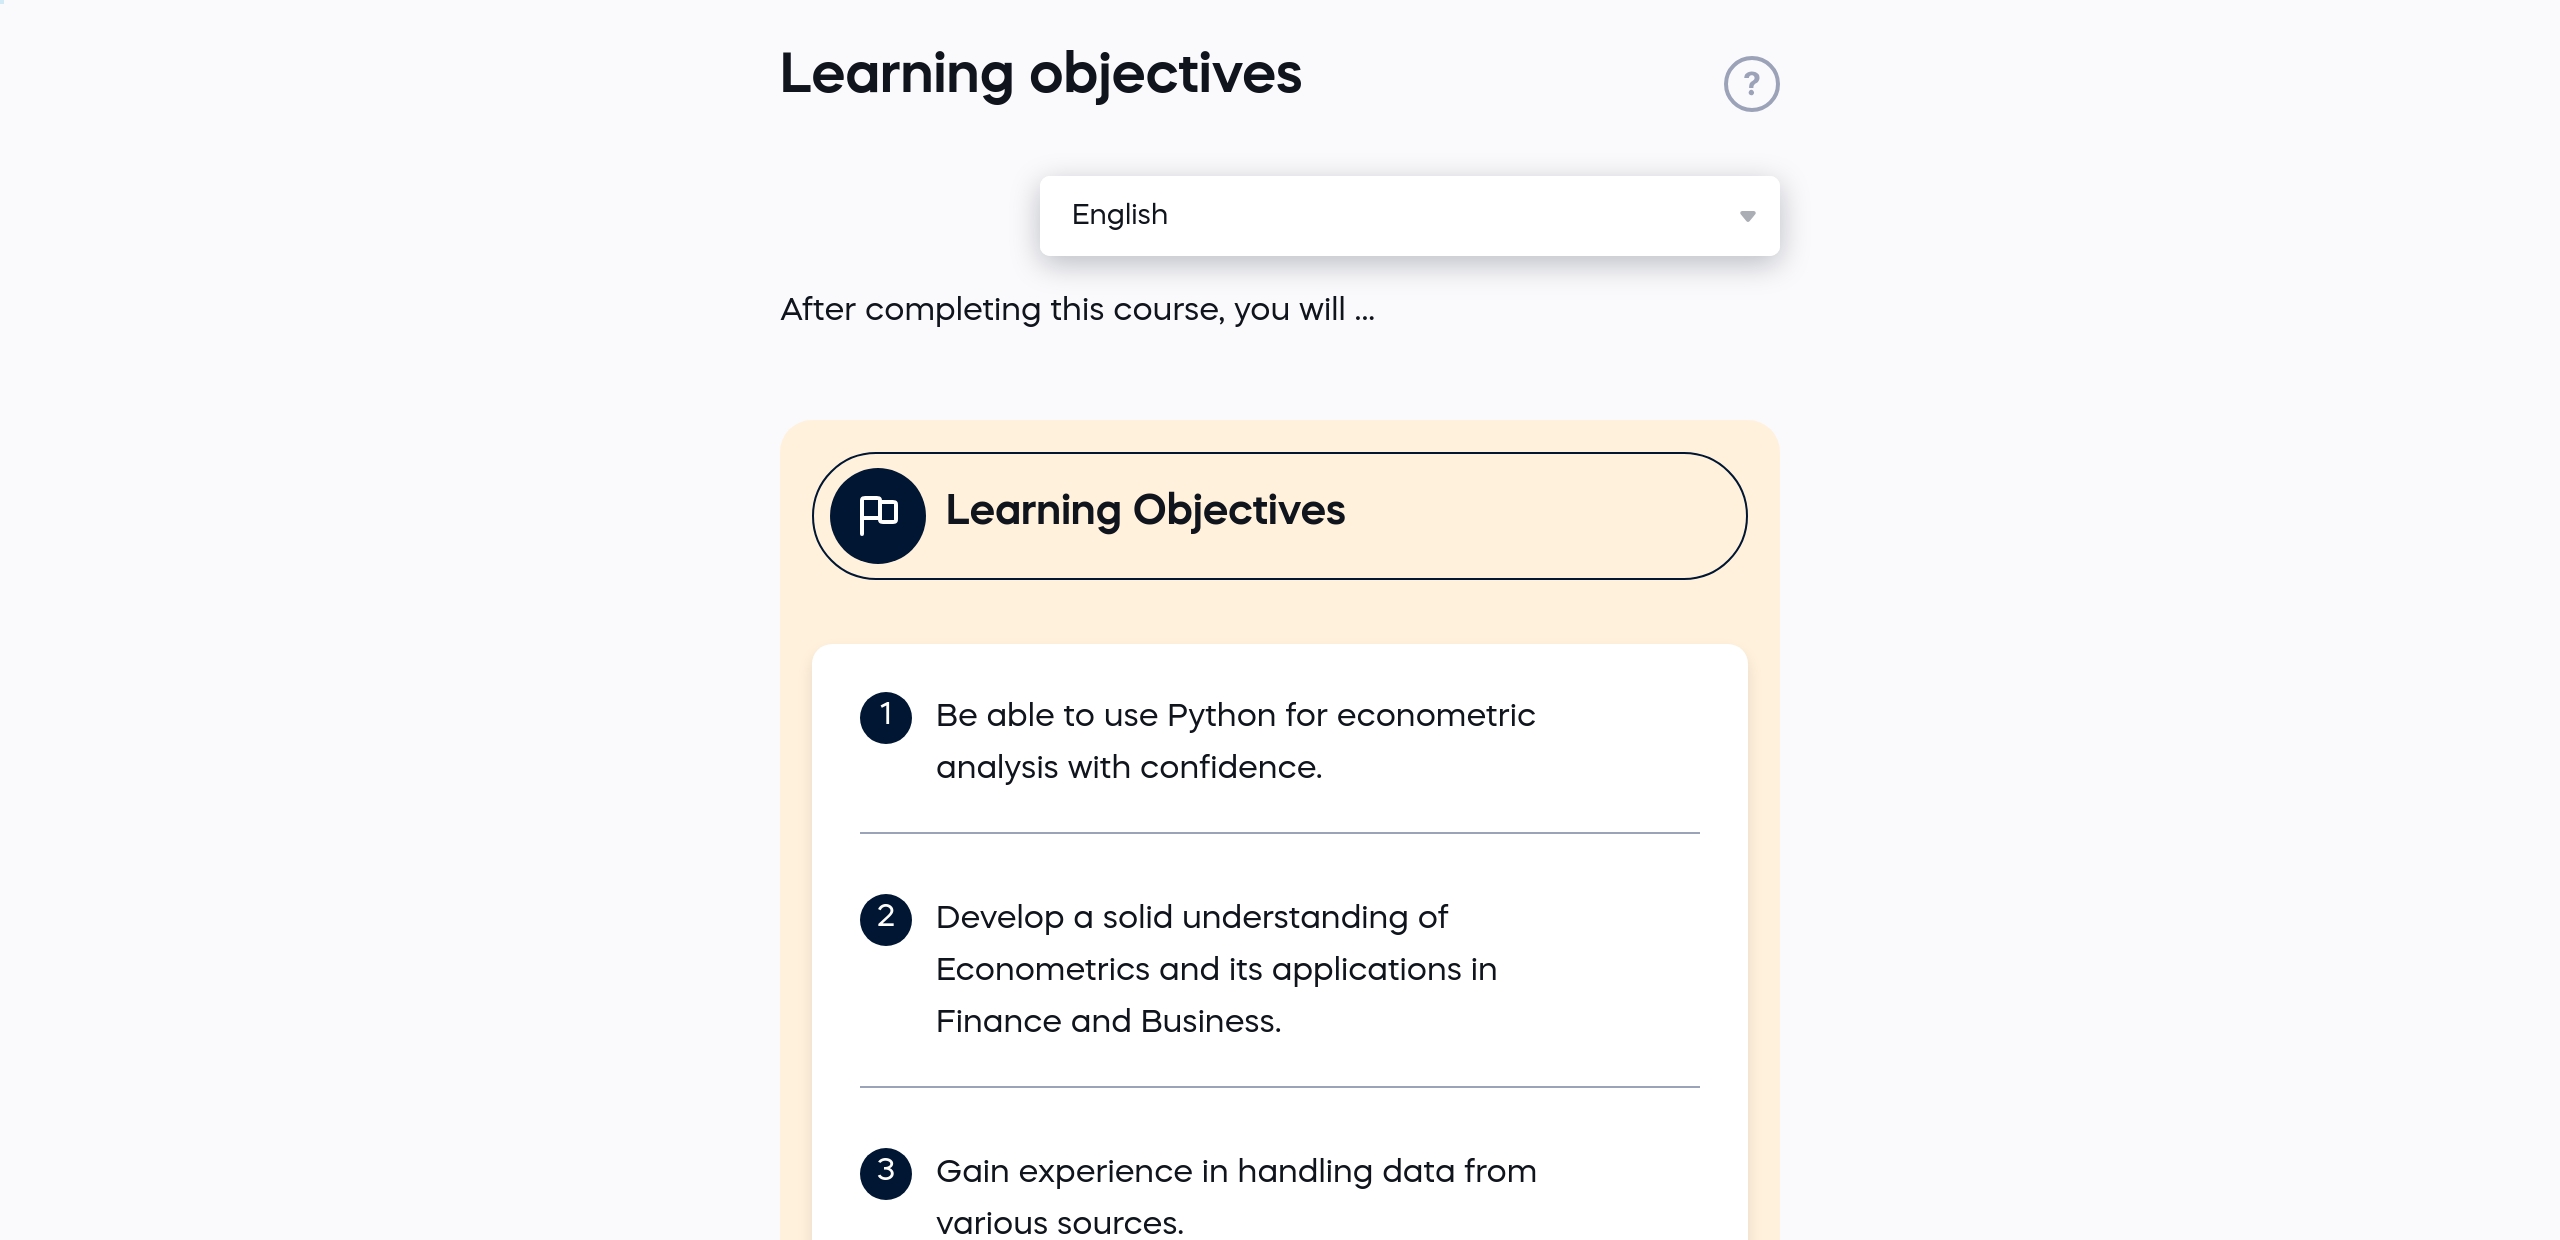
1.3 Learning objectives
1 min
1.4 Course overview
2 min
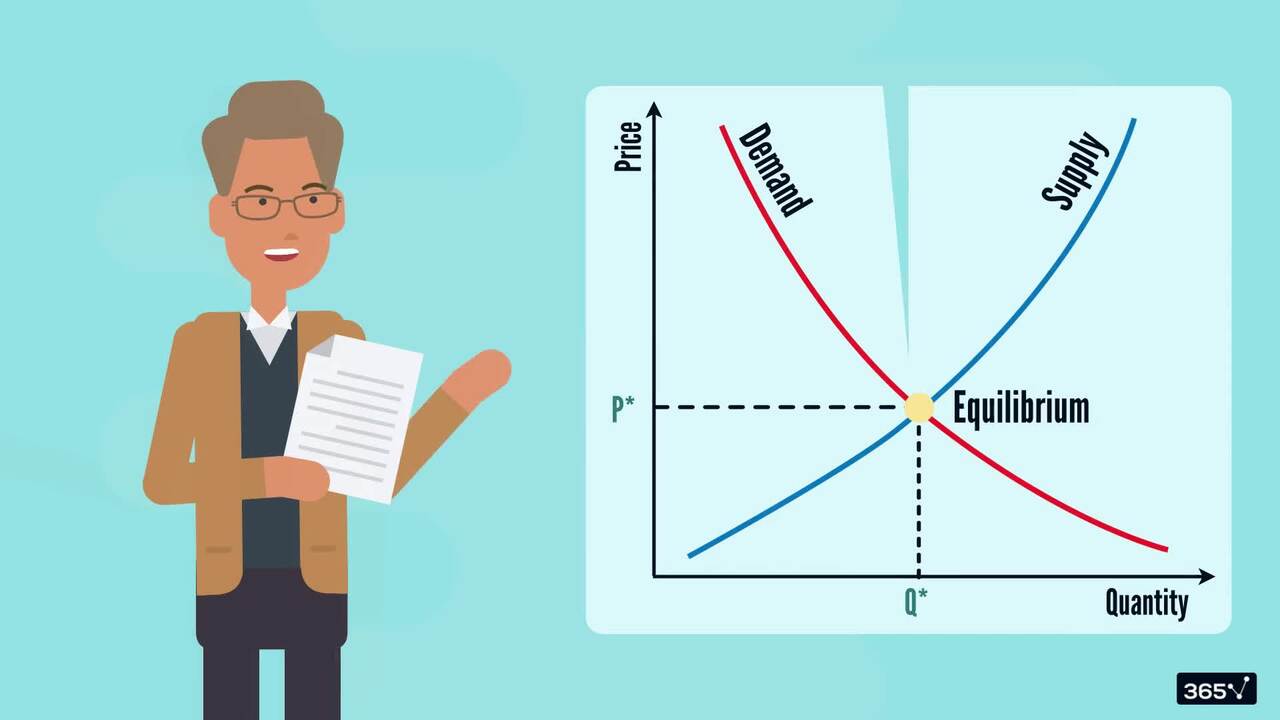
1.5 What is Econometrics?
1 min
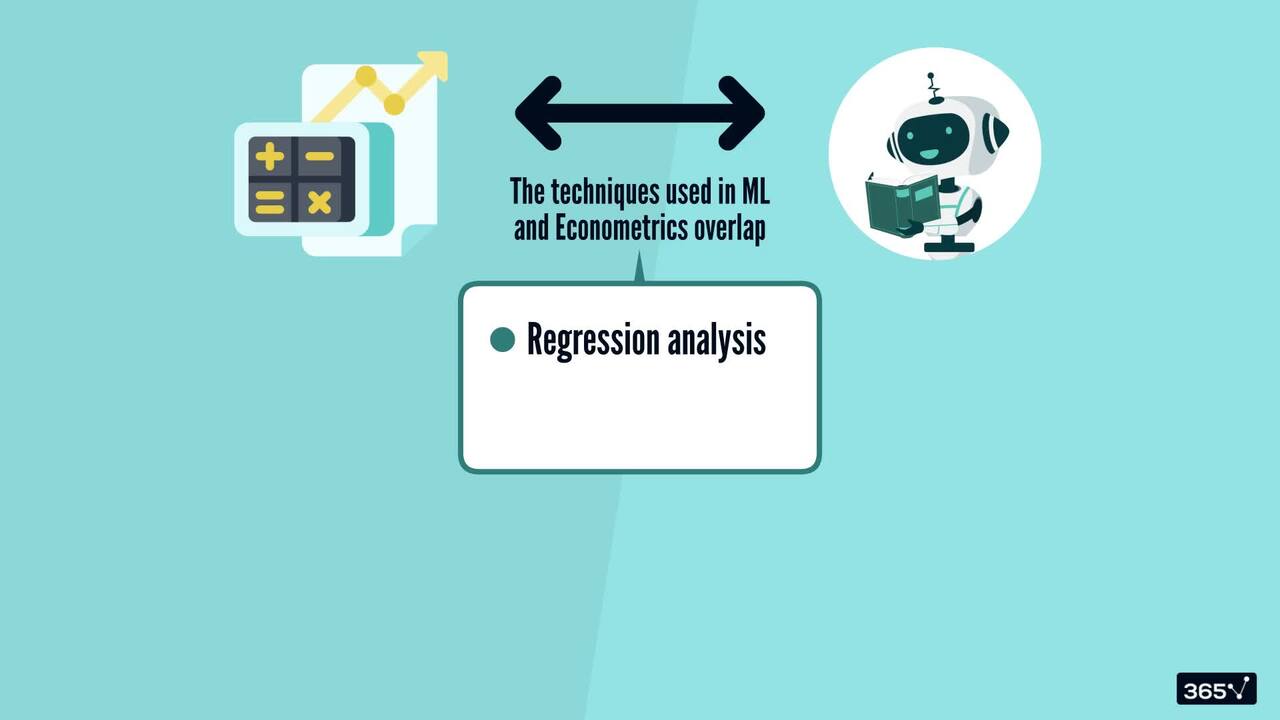
1.6 Machine learning vs Econometrics
1 min
Curriculum
Topics
Course Requirements
- Python (version 3.8 or later), Streamlit library, OpenAI API key, and a code editor or IDE (e.g., VS Code or Jupyter Notebook)
- Basic familiarity with Python programming is required.
- Familiarity with basic statistics and linear algebra is helpful but not mandatory.
Who Should Take This Course?
Level of difficulty: Beginner
- Anyone who wants to pursue quantitative jobs in Finance and Economics that rely on econometric modelling.
- Data analysts who want to enhance their skills in linking theory and empirical models, which are often lacking in machine-learning courses.
- Finance professionals who want to understand the underlying drivers of economic and financial outcomes.
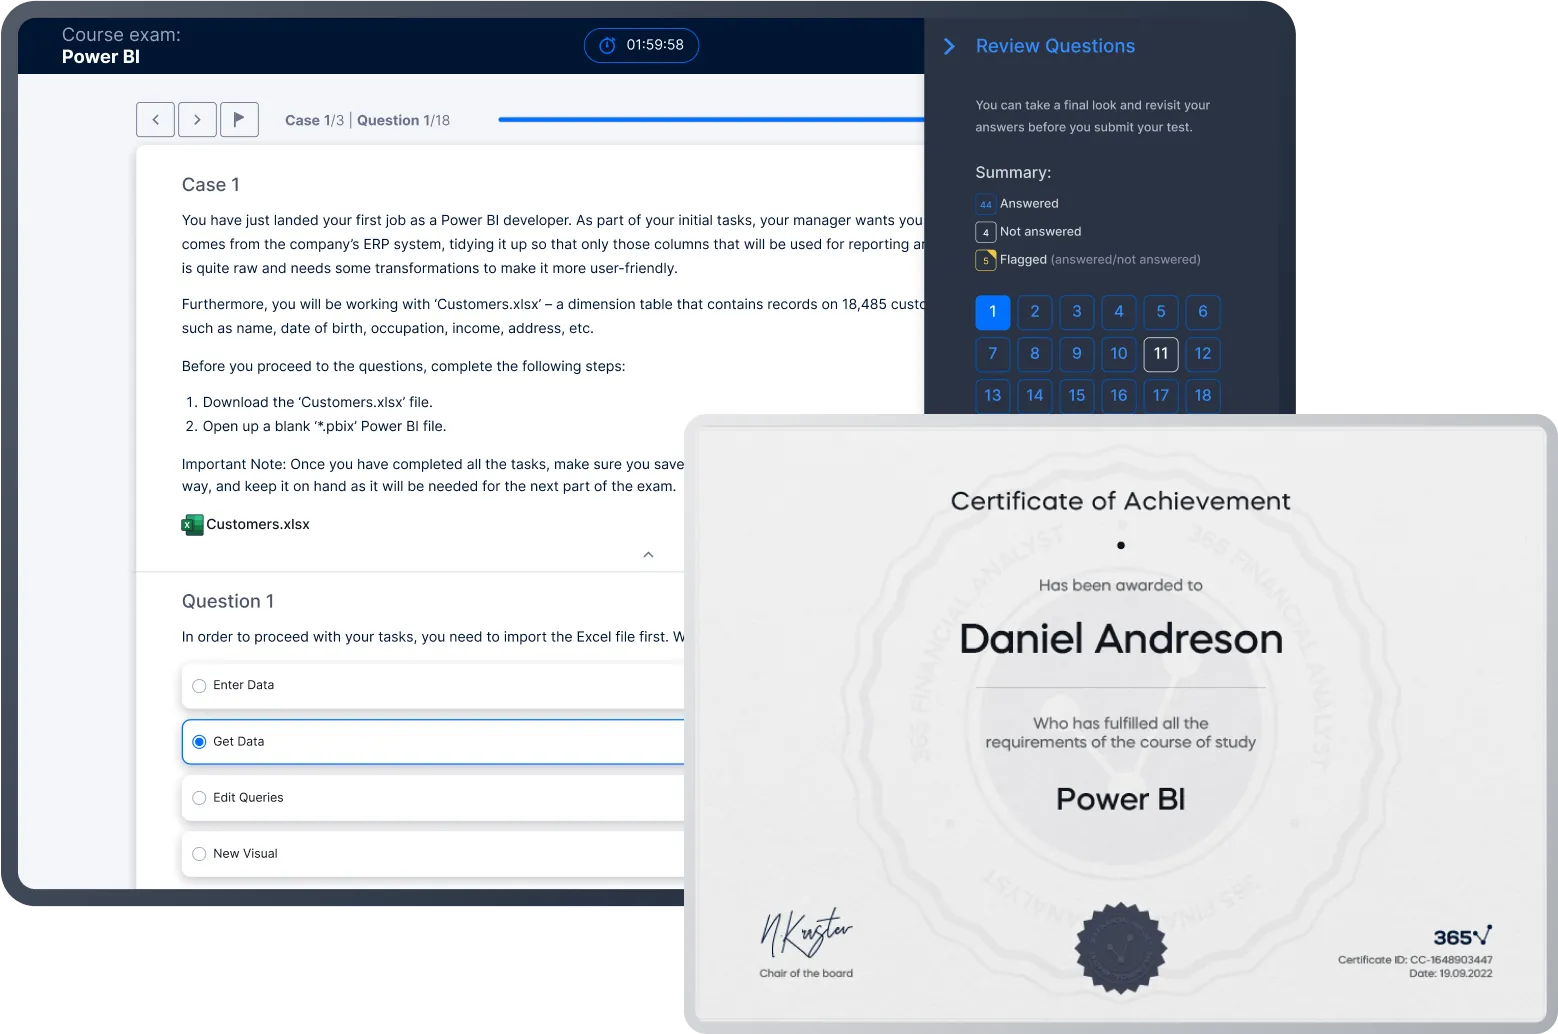
Exams and Certification
A 365 Financial Analyst Course Certificate is an excellent addition to your LinkedIn profile—demonstrating your expertise and willingness to go the extra mile to accomplish your goals.
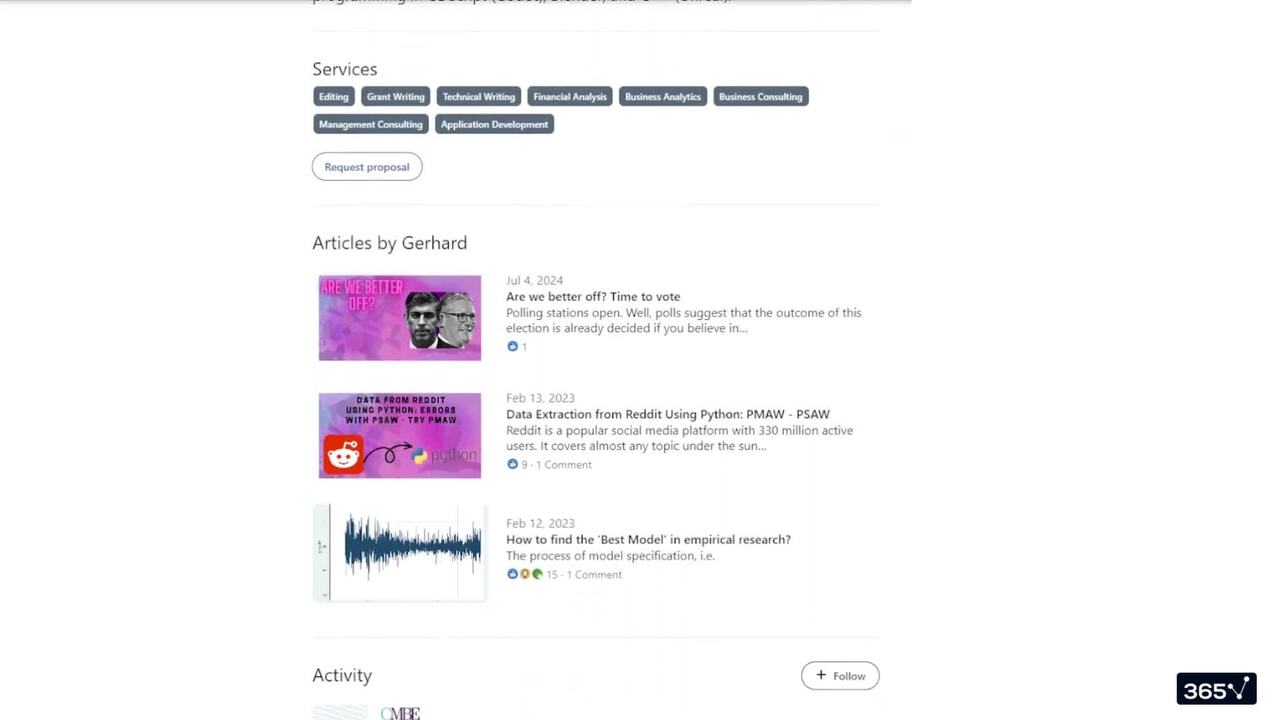
Meet Your Instructor


I am a Chair in Finance at the University of Aberdeen with 20 years of experience in higher education, having previously held positions at SOAS, the University of Southampton, UWE, and Utrecht University. As a Practice Specialist in Corporate Finance at McKinsey & Company, I primarily focused on firm valuation and mergers and acquisitions (M&As). Since January 2022, I have served as the Director and Secretary of YUNIKARN LTD, an educational content creation and consulting firm. The company’s YouTube channel, YUNIKARN, offers free courses in data science using Python and Stata. I have provided consulting services for notable organizations, including McKinsey & Company (2007–2010), HMRC (2012–2015), Industrial Bank (China) (2013), Brunello Cucinelli (2018), China State Shipbuilding Corporation (2019), the Third Bureau of Supervision of SASAC (2019), and the Economic Research Institute for ASEAN and East Asia (ERIA) (2021–2022). With a background in economics (PhD, BSc/MSc), mathematics (BSc/MSc), and programming (Python, C/C++, MATLAB, Stata, etc.), I specialize in machine learning (ML), artificial intelligence (AI), and their applications in FinTech. I have acted as principal or co-investigator on several large-scale projects, including initiatives in FinTech (ESRC-NSFC: GBP 0.5 million), IoT (FP7: EUR 2.6 million), and satellite technology (FP6: EUR 11.9 million).
What Our Learners Say

365 Financial Analyst Is Featured at
Our top-rated courses are trusted by business worldwide.