Data Analysis with Excel Pivot Tables
Learn how to work with Excel pivot tables and create world-class reports, interactive dashboards, and insightful analyses
 Start for free
What you get:
- 2 hours of content
- 7 Interactive exercises
- 23 Downloadable resources
- World-class instructor
- Closed captions
- Q&A support
- Future course updates
- Course exam
- Certificate of achievement
Data Analysis with Excel Pivot Tables
Start for free
What you get:
- 2 hours of content
- 7 Interactive exercises
- 23 Downloadable resources
- World-class instructor
- Closed captions
- Q&A support
- Future course updates
- Course exam
- Certificate of achievement
Start for free
What you get:
- 2 hours of content
- 7 Interactive exercises
- 23 Downloadable resources
- World-class instructor
- Closed captions
- Q&A support
- Future course updates
- Course exam
- Certificate of achievement
What you learn
- Understand how to build and use basic Excel pivot tables.
- Improve accuracy and confidence using pivot tables.
- Clean and organize data effectively before analysis.
- Format data professionally for clear pivot table reports.
- Use slicers and pivot tables to generate actionable insights.
Top Choice of Leading Companies Worldwide
Industry leaders and professionals globally rely on this top-rated course to enhance their skills.
Course Description
Pivot tables are essential Excel tools for analyzing large datasets—crucial for every analyst, especially early in their career.
This Excel pivot table course covers fundamental and advanced skills. We'll begin with basic tables and pivot table fundamentals, then progress to editing data sources and updating pivot table content. We’ll also introduce the GETPIVOTDATA function, which allows you to extract data from your pivot table reports.
This leads us to the second part of the course, which features a comprehensive real-world case study showing you how to create an interactive and flexible business report using pivot tables and slicers. This real-life example sets this course apart because it equips you with the ability to craft world-class business reports—a skill that will distinguish you in any company.
The Excel data analysis course suits graduates and young professionals lacking practical experience with Excel pivot tables. It’s also highly recommended for analysts without practical training who have not designed interactive dashboards and business reports with pivot tables. No experience with Excel and pivot tables? No problem! Our pivot table course covers all the essentials, starting from the basics.
Why is this one of the top online pivot table courses?
- Exceptional Content Quality
Through video lessons and practice exercises, you'll master professional formatting and learn to build interactive business dashboards using pivot tables, GETPIVOTDATA, and slicers. - Instructor Excellence
This Excel pivot table training stands out thanks to our instructor, Ned Krastev, who applies best practices from his experience at world-class companies. Learn directly from someone who has excelled in top-tier organizations and knows what it takes to succeed. - Student Reviews and Feedback
Students have expressed gratitude for the high-quality instruction and content in our pivot table training. Many impressed their employers on their first days at new jobs by showcasing excellent Excel and pivot table skills. - Comprehensive Downloadable Material
The course includes numerous valuable resources (model templates, exercise files, course notes, practice assessments) that you can download and use as references anytime. - Certificate of Achievement
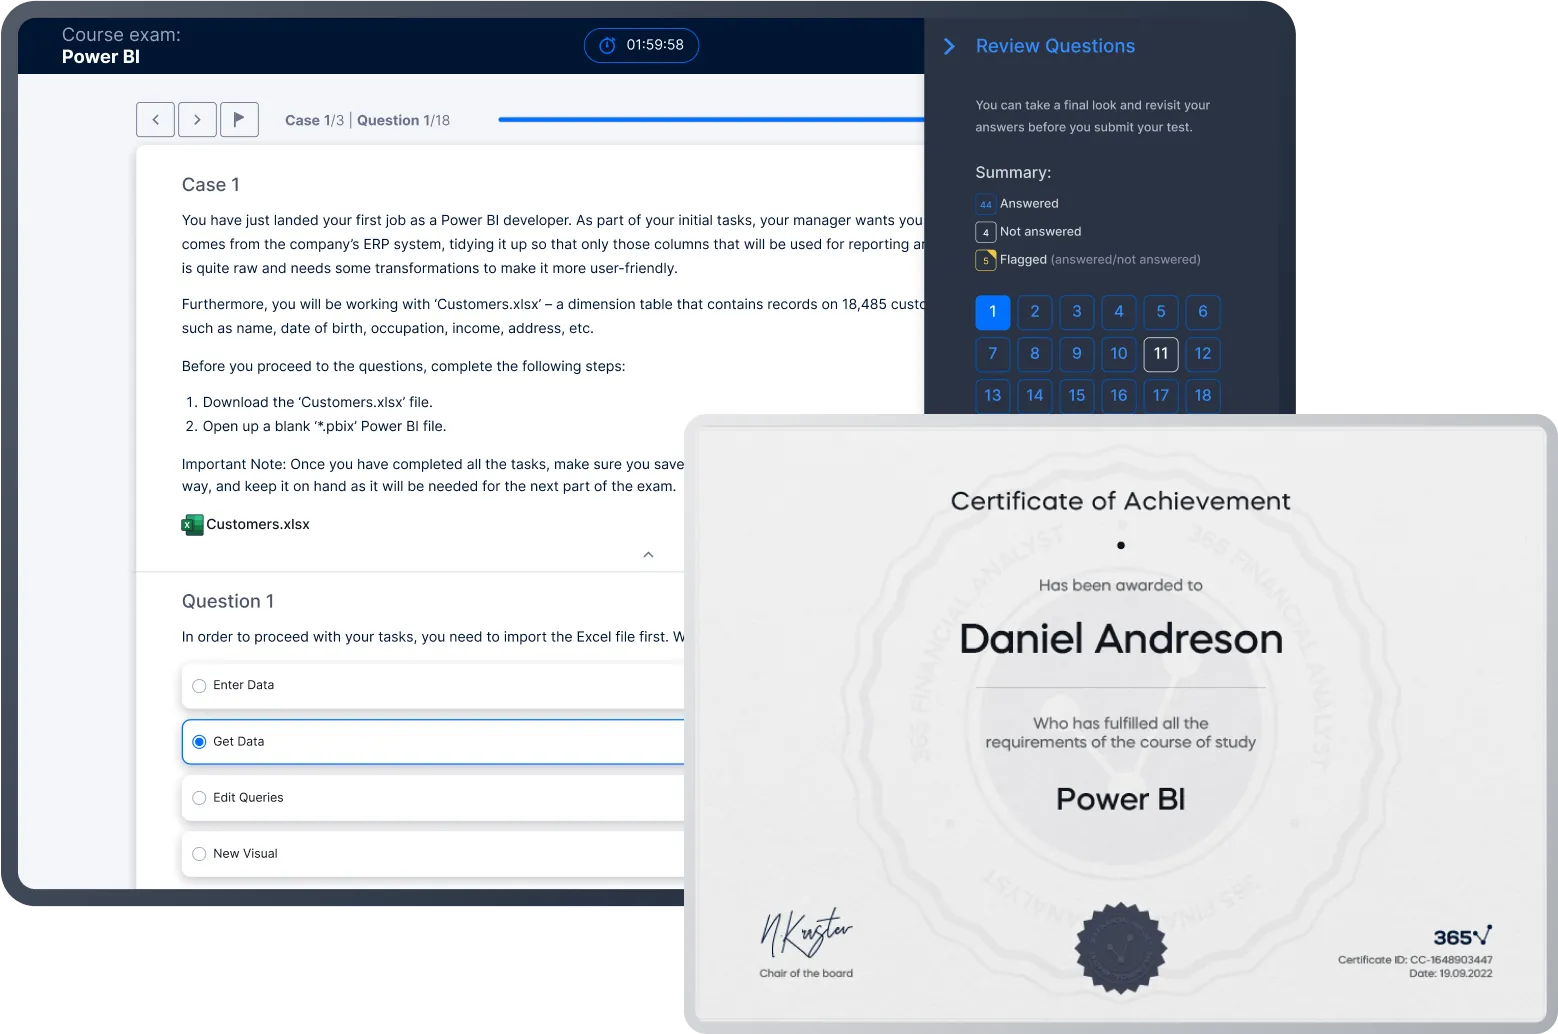
Completing the Data Analysis with Excel Pivot Tables course and passing its exam will earn you a verifiable certificate of achievement—recognizing your dedication and hard work.
Hundreds of online Excel pivot table courses exist, yet few match the depth of this training. You'll master pivot table creation and manipulation and gain essential data analysis skills for crafting world-class business reports.
Join us for a transformative journey where you'll learn to create, edit, and format pivot tables, work with GETPIVOTDATA and slicers, enhance report layouts and structures, and master extracting data from pivot tables.
In just a few hours, gain the practical skills that top professionals at leading companies have mastered over the years.
Click the 'Buy Now' button to embark on an incredible learning journey and transform your career.
Learn for Free

1.1 Introduction to the course
1 min
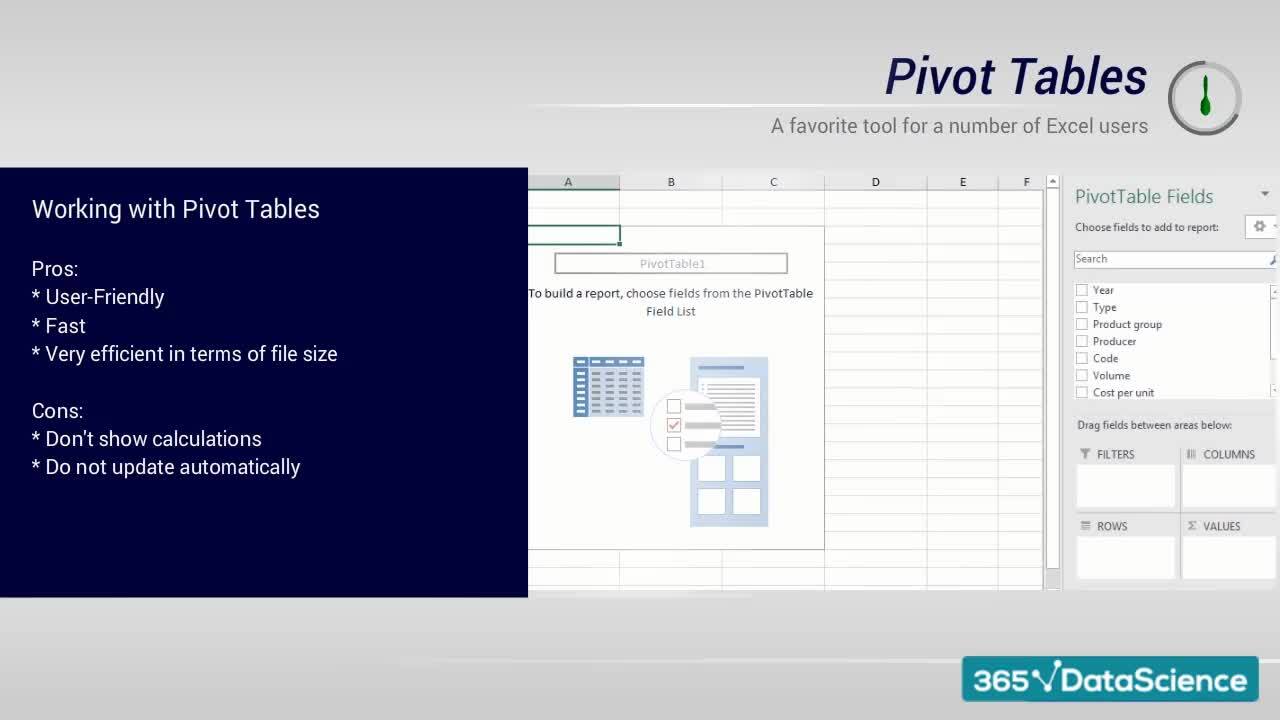
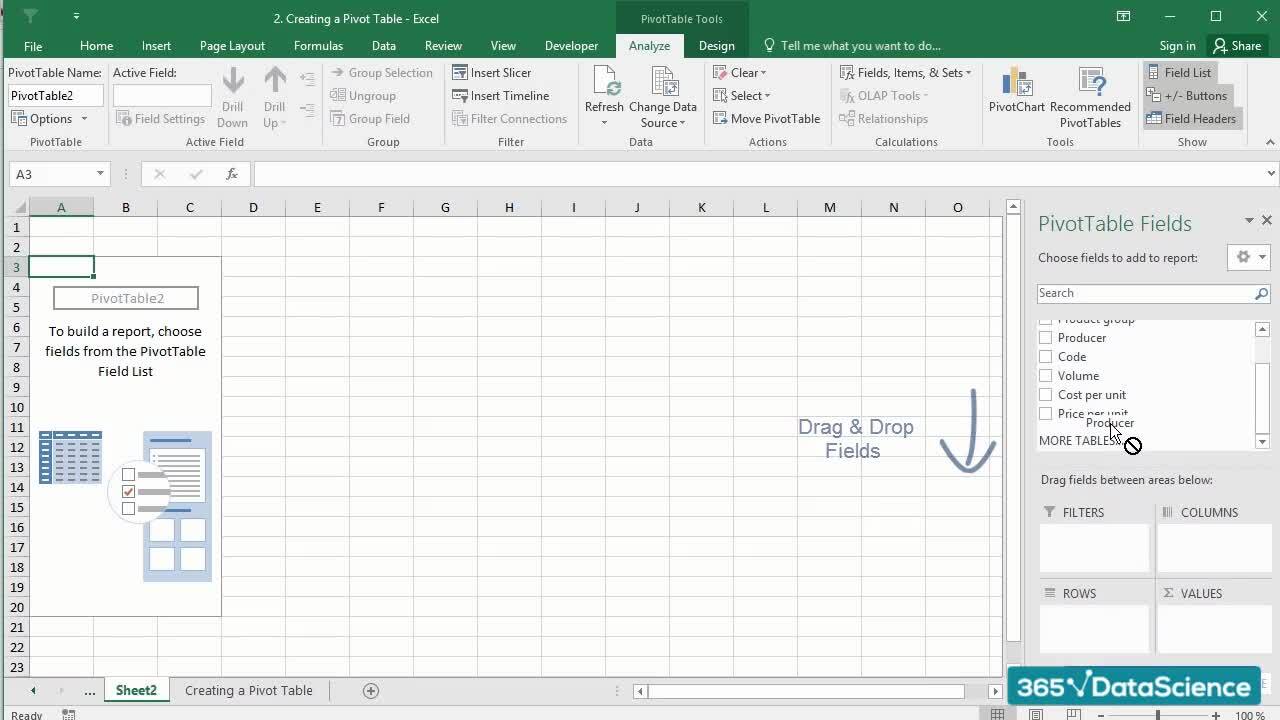
1.2 Intro to Pivot tables
2 min
1.3 Editing a Pivot table
4 min
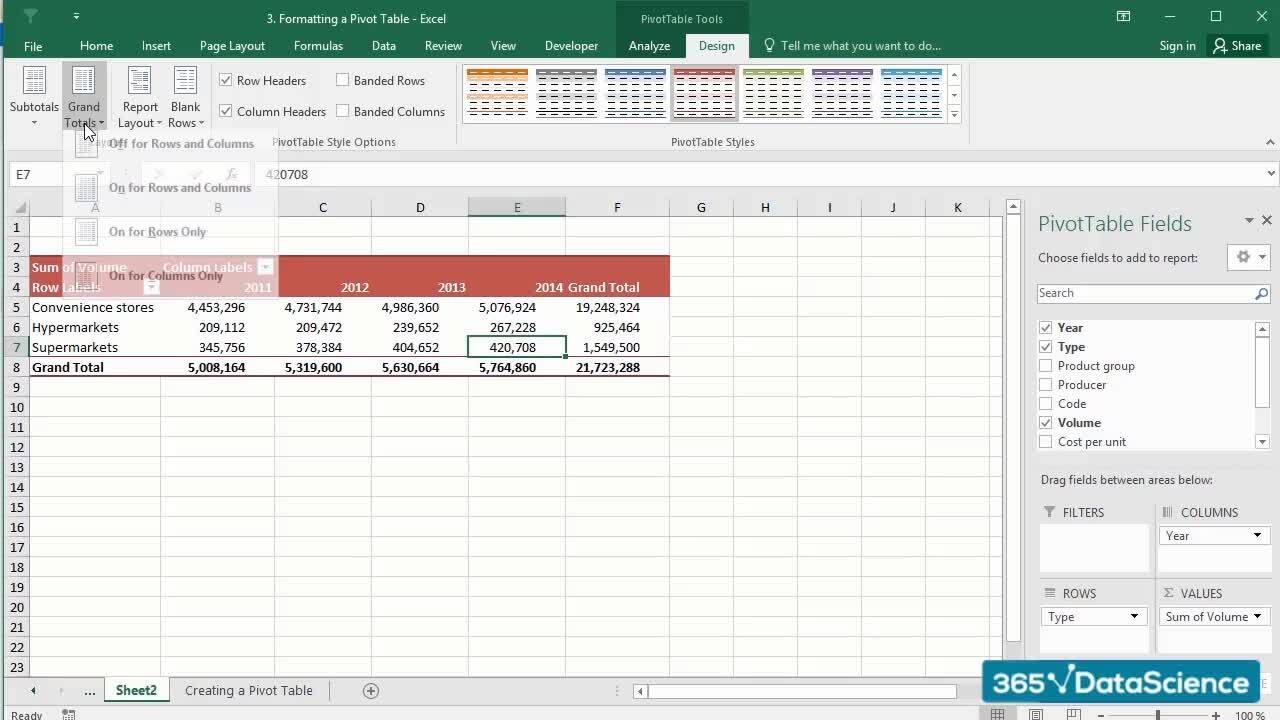
1.5 Formatting a Pivot table
2 min
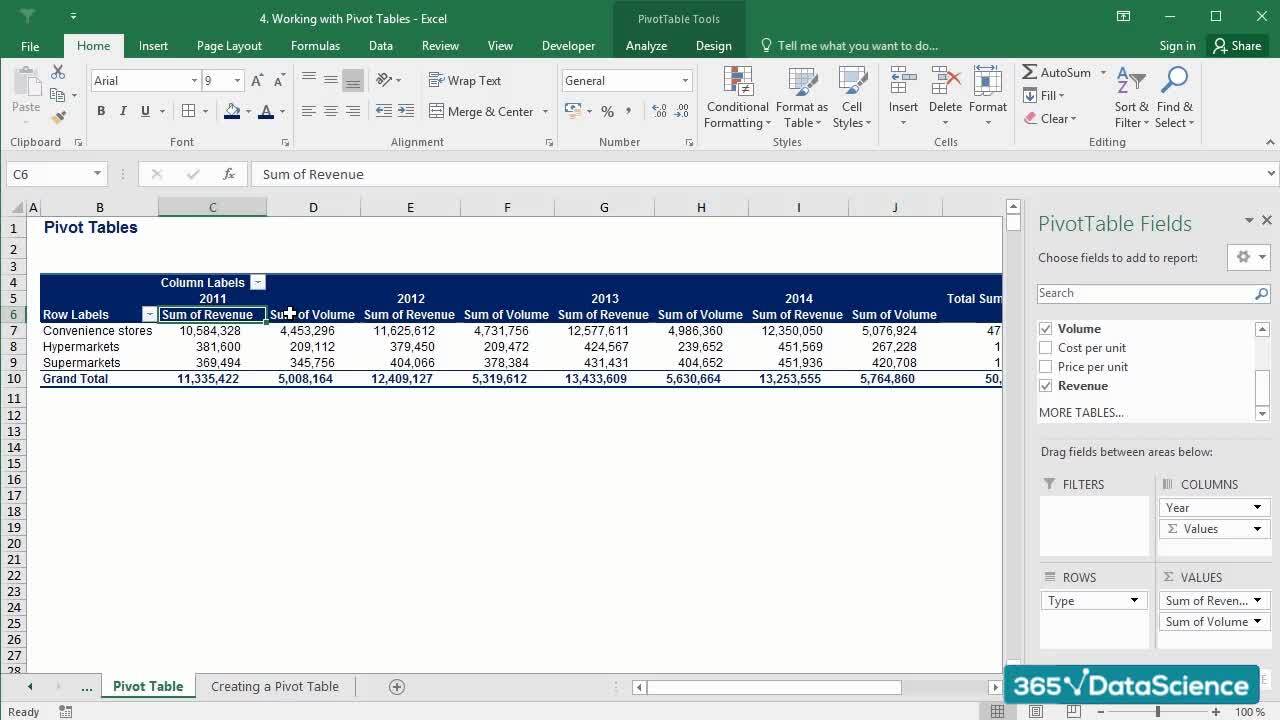
1.6 Adjusting a Pivot table
4 min
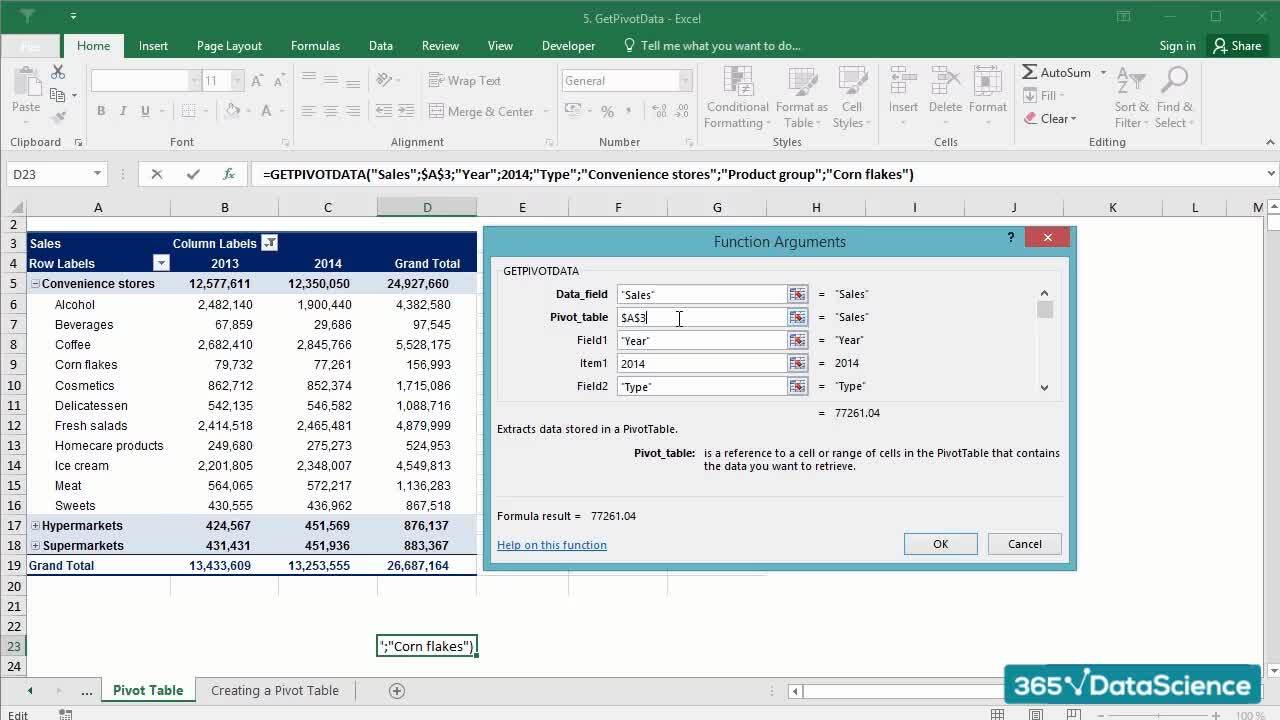
1.8 GETPIVOTDATA
3 min
Curriculum
- 2. Building a world-class report with GETPIVOTDATA (practical exercise)12 Lessons 34 MinOnce you are familiar with the basic pivot table operations, we will be ready to learn how to build a world-class financial report using pivot tables, the GETPIVOTDATA function, and slicers.Introduction to the case study2 minWorking with an SAP data extraction3 minPreliminary mapping of the data extraction2 minCreating an output structure of the FMCG model2 minImproving the layout and appearance of the FMCG report4 minInserting formulas and automating calculations2 minCreating a Master Pivot Table: The main data source for the FMCG report2 minGetPivotData is great! Extracting data from the Master Pivot Table6 minGETPIVOTDATA - fix1 minCombining Slicers and GetPivotData: The key to our success3 minGetting fancy with Excel slicers3 minThis is how the report can be used in practice by high-level executives4 min
Topics
Course Requirements
- Microsoft Excel (any recent version, such as Excel 2019, 2021, or Microsoft 365)
- Basic familiarity with Excel
Who Should Take This Course?
Level of difficulty: Intermediate
- Beginner and intermediate Excel students
- Aspiring financial analysts and data analysts
- Graduate students who want to learn how to work with Excel pivot tables professionally
Exams and Certification
A 365 Financial Analyst Course Certificate is an excellent addition to your LinkedIn profile—demonstrating your expertise and willingness to go the extra mile to accomplish your goals.
Meet Your Instructor


Ned Krastev is an entrepreneur and educator who has helped over 1.6 million students worldwide gain business, finance, and data skills. After earning his Master's degree in Finance from Bocconi University in Milan, he built a career with leading companies including PwC Italy, Coca-Cola European Partners, and Infineon Technologies. In 2014, Ned published his first online course on financial modeling and valuation, sparking his passion for online education. Today, as Founder & CEO of 365 Careers and Co-founder of 365 Data Science, he leads one of the most successful global providers of professional training, aiming to bridge the gap between academic theory and real-world business application.
What Our Learners Say


365 Financial Analyst Is Featured at
Our top-rated courses are trusted by business worldwide.