Risk Aversion and Implications for Portfolio Selection
Risk aversion is a key factor in how investors make portfolio decisions, reflecting their preference for certainty over uncertainty. This article explains how different levels of risk aversion influence investor behavior, portfolio choice, and utility, using practical examples and visual tools, such as indifference curves.
Join over 2 million professionals who advanced their finance careers with 365. Learn from instructors who have worked at Morgan Stanley, HSBC, PwC, and Coca-Cola and master accounting, financial analysis, investment banking, financial modeling, and more.
Start for Free
When making investment decisions, two fundamental concepts must be considered: risk and return. Every investment comes with a potential reward and an associated level of uncertainty. The way investors perceive and respond to this uncertainty—commonly referred to as risk aversion—plays a crucial role in determining the optimal portfolio for everyone. This article examines the concept of risk aversion, categorizes investor types, and explains how these preferences influence portfolio selection using utility theory and indifference curves.
What Is Risk Aversion?
Risk aversion refers to a preference for certainty over uncertainty—even when the expected returns are the same. A risk-averse individual prefers a guaranteed outcome to a gamble with equal or greater expected value due to the discomfort associated with potential losses.
Consider a coin-flip scenario: if the coin lands on tails, you win $100; heads, you get nothing. The expected value of this gamble is $50. A risk-averse investor, however, may prefer to take a sure $50 payout instead of risking a chance at $100 with a 50% probability.
Types of Investors
Investors can be broadly categorized into three groups:
- Risk-averse prefer lower risk even if it means lower returns. They seek certainty and stability, especially if the stakes are high.
- Risk-neutral is indifferent to risk. They focus solely on maximizing returns, regardless of the uncertainty involved.
- Risk-seeking prefers higher risk, often valuing the thrill or potential upside of uncertainty more than the safety of guaranteed returns.
Consider two investments (A and B) with the same expected return—but B has a higher risk. A risk-averse investor will choose A to avoid added uncertainty. A risk-neutral investor is indifferent between the two options, while a risk-seeking investor—unconstrained by risk aversion—will likely prefer B for its higher volatility and potential reward.
The Role of Utility in Investment Decisions
Measuring Preferences with Utility
Utility is a key concept in economics used to measure satisfaction. In finance, it helps quantify how much satisfaction or “happiness” an investor derives from a portfolio. The utility function integrates expected return and risk (variance) alongside the investor’s risk aversion:
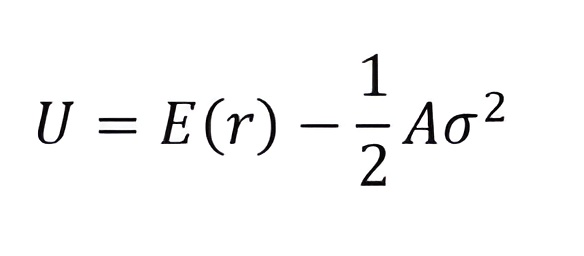
Utility = Expected Return – (Risk Aversion Level × Risk)
Higher values of A indicate greater sensitivity to risk. Risk-averse investors (A > 0) experience a decrease in utility as risk increases. Risk-neutral investors (A = 0) are unaffected by risk. Risk-seeking investors (A < 0) may perceive higher risk as increasing their utility.
Practical Example
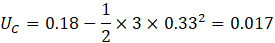
Assume a portfolio has an expected return of 7% and a standard deviation of 15%. If an investor has a risk aversion coefficient of 4, their utility is:
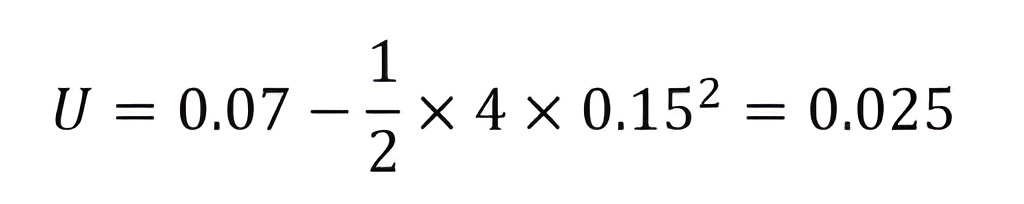
This provides a numerical framework for comparing portfolios.
Indifference Curves and Investment Choices
What Are Indifference Curves?
Indifference curves represent combinations of risk and return that yield the same level of utility. A risk-averse investor is equally satisfied with any portfolio on a given curve. Moving up and to the left (higher return, lower risk) increases utility, aligning with the preferences shaped by risk aversion.
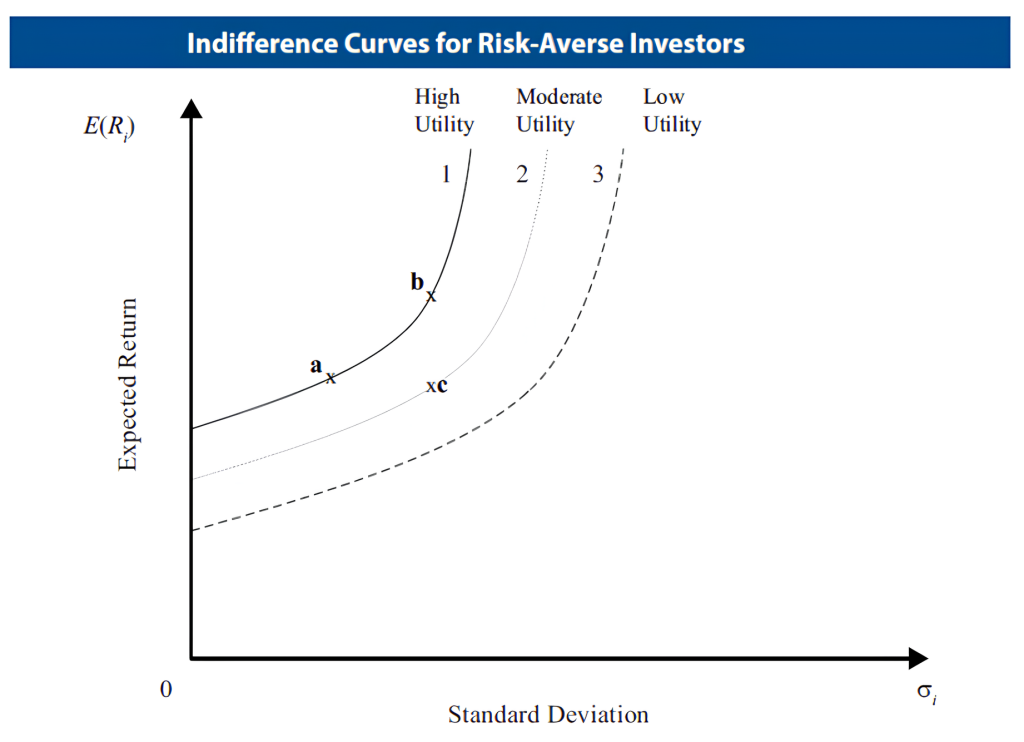
These curves are upward-sloping and become steeper as risk aversion increases—reflecting the Law of Diminishing Marginal Utility (LDMU). As risk increases, the additional return must increase disproportionately to maintain satisfaction.
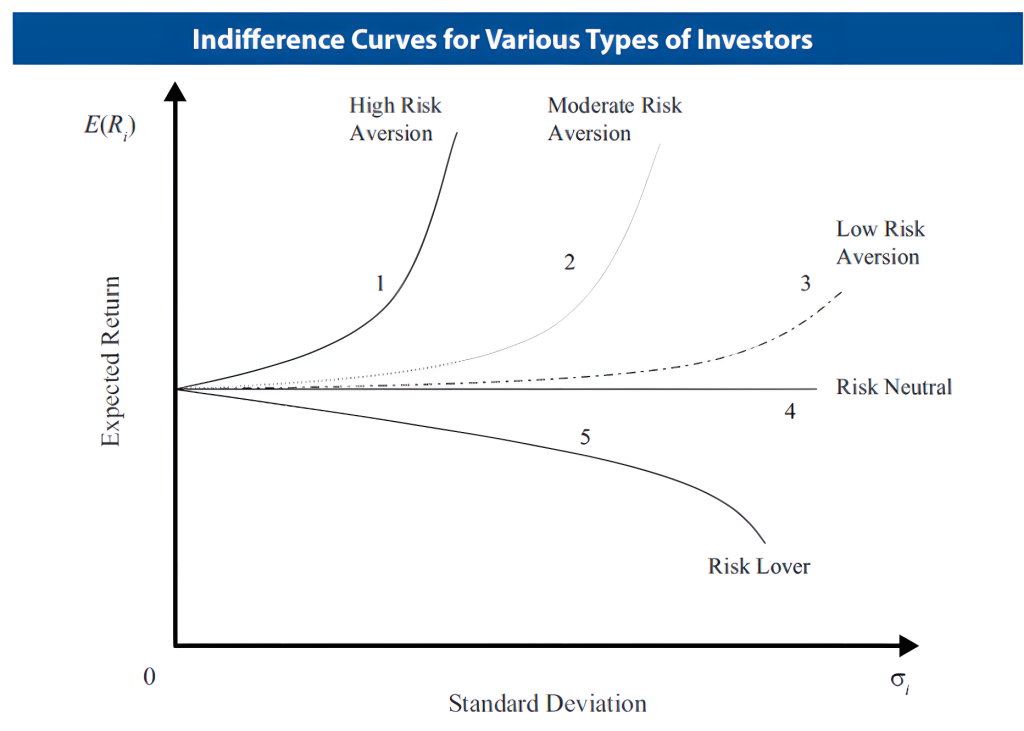
- Risk-Averse: Steep, upward-sloping curves
- Risk-Neutral: Horizontal lines
- Risk-Seeking: Downward-sloping curves
Matching Investors to Portfolios
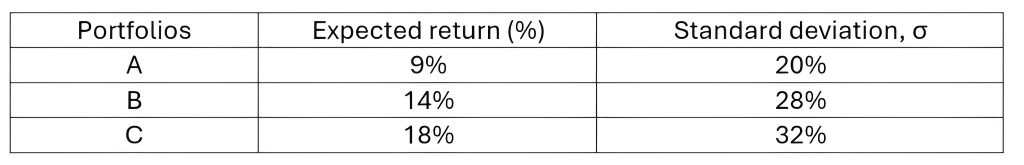
Let’s evaluate three portfolios:
Portfolios (ABC): Expected Return, Standard Deviation
And three investor types:
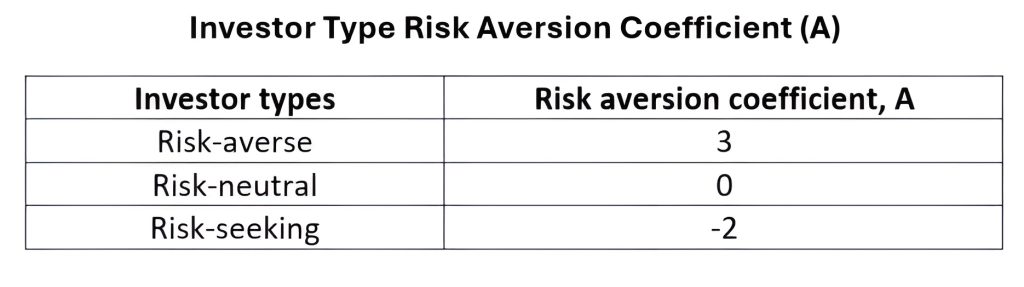
Risk-Averse Investor
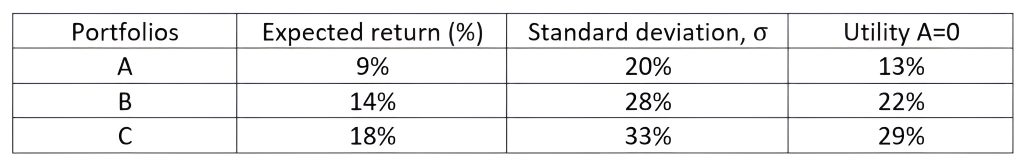
Using the utility formula:
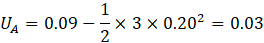
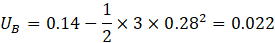
Portfolio A offers the highest utility, making it the preferred choice for the risk-averse investor.
Risk-Neutral Investor
Since A=0A = 0A=0, utility equals return:
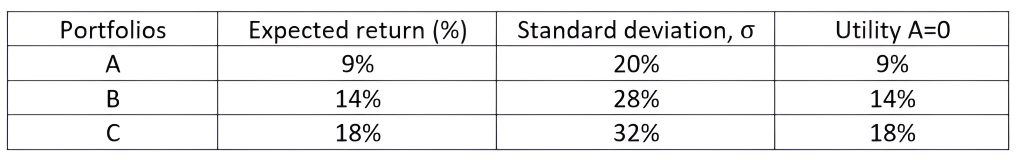
Portfolio C, offering the highest return, is optimal.
Risk-Seeking Investor
With A=−2A = -2A=−2:
Portfolio C again offers the highest utility and aligns with the risk-seeking investor’s preferences.
Risk Aversion and Smarter Portfolio Choices
Investment decisions are deeply rooted in individual attitudes toward risk. Understanding whether an investor is risk-averse, risk-neutral, or risk-seeking is essential for aligning portfolio choices with personal comfort and financial goals. Risk aversion plays a central role in this process, influencing how much uncertainty an investor is willing to tolerate in exchange for potential returns. The utility function provides a mathematical framework to evaluate these preferences, while indifference curves visually represent the trade-offs investors are willing to make between risk and return. Ultimately, the key to portfolio optimization lies not in chasing the highest return but in maximizing individual satisfaction—balancing risk in a way that feels both rational and rewarding.